September 2026 New Home Sales: Sales Held Up Better Than Expected

Key Takeaways
- Sales held steady in September but remain below last year’s level. Builders sold new homes at a 676,000 annual pace, down 0.6% from August and 5.3% from a year ago. Sales through September are 2.9% lower than in 2025.
- More than half of new homes sold for less than $400,000. The share rose to 51% from 46% a year earlier. Sales below $300,000 are up nearly 7% so far this year.
- Buyers are purchasing more homes before construction begins. Sales of homes not yet started rose 17% from a year ago, even as sales of completed homes fell 11%.
- Fewer finished-home sales reflect last year’s pullback in homebuilding. That slowdown has reduced the number of homes being completed and the supply of move-in-ready homes available for sale.
- The high end still offers opportunities. New-home sales above $600,000 have weakened, but the broader luxury resale market is improving. Builders should not overlook markets where expensive homes remain scarce.
Buyers haven’t gone away. They’re looking for better deals.
The latest new-home sales report points to resilient housing demand despite mortgage rates above 7%, especially at lower price points. Sales held steady in September but remain below last year’s level. More than half of new homes sold for less than $400,000, and sales below $300,000 are still growing this year.
What’s interesting is that buyers kept purchasing homes even as fewer finished homes were available. Sales of completed homes fell 11% from a year ago, alongside a 9% decline in completed homes available for sale. Meanwhile, sales of homes that had not yet been started jumped 17%. Buyers appear willing to wait when the price and terms make sense.
Builders have been adjusting to the affordability squeeze for years. They’ve been building smaller homes on smaller lots, cutting prices and offering more incentives. According to the National Association of Home Builders, 66% of builders offered sales incentives in September, while 38% cut prices by an average of 6%. That helps explain why sales have held up better at lower price points.
Mortgage rates moved above 7% in September, adding to the affordability pressure buyers already face. Yet new-home sales held steady for the month. Buyers haven’t disappeared. They’re responding to the prices and terms builders are offering.
Sales held steady in September but remain below last year’s pace
Builders sold new homes at a seasonally adjusted annual rate of 676,000 in September. That was 0.6% below August and 5.3% below September 2025. Census also revised August sales down to 680,000 from 684,000.
The trend remains soft, but sales are holding up despite the affordability squeeze. Builders sold about 506,000 new homes from January through September, 2.9% fewer than a year earlier. That was the lowest January-through-September total since 2018, though still about 5% above the pre-pandemic (2016–2019) average.
The West remains the weak spot. Year-to-date sales there are down 9%, compared with a 1% decline in the South. The Midwest is roughly flat, while the smaller Northeast market is up 2%. The South still accounts for about six of every ten new homes sold.
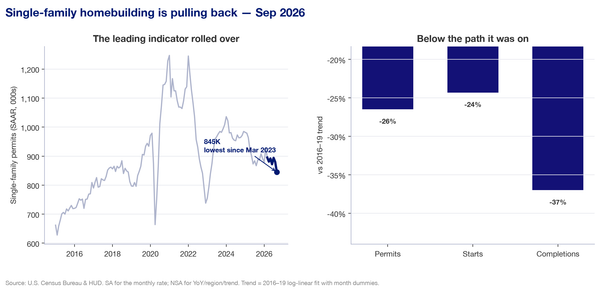
Regional differences also reflect changes in where builders are investing. Permitting and homebuilding activity have shifted toward parts of the Midwest and Northeast, markets with relatively stronger price and rent growth. Many of the homes being sold are not yet finished, so today’s sales also reflect builders’ construction pipelines.
More than half of new homes sold for under $400,000
Buyers kept moving toward cheaper homes. In September, 51% of new homes sold for less than $400,000, up from 46% a year earlier. Homes priced at $1 million or more fell to 4% of sales from 6%.
This month, the gain came just below the $400,000 mark. The $300,000–$400,000 range rose to 31% of sales from 23%. The share under $300,000 slipped to 20% from 23%.
The year-to-date numbers show where sales are holding up and where they are losing ground. Homes under $300,000 are still the fastest-growing range, with sales up nearly 7%. Homes between $600,000 and $1 million have lost the most ground, with sales down 13%.
| Price range | Jan.–Sep. 2025 | Jan.–Sep. 2026 | Change |
|---|---|---|---|
| Under $300k | 88k | 94k | +6.8% |
| $300k–$400k | 152k | 151k | −0.7% |
| $400k–$600k | 164k | 157k | −4.3% |
| $600k–$1M | 84k | 73k | −13.1% |
| $1M+ | 30k | 28k | −6.7% |
Growth at the bottom has cooled from about 11% through August. That is partly because September 2025 was a strong month for sales below $300,000. Still, this is the only price range where sales have increased so far this year.
Builders have been working to bring more affordable homes to market. They’ve reduced floor plans, built on smaller lots and offered financial incentives to help buyers qualify. In September, 66% of builders reported using sales incentives, while 38% cut prices by an average of 6%, according to NAHB. Those adjustments help explain why sales have held up better at lower price points.
The drop at the top deserves a different interpretation. Builders have shifted more of their production toward cheaper homes, which may be limiting the supply of expensive new homes. The Census price tables cannot separate that effect from weaker demand. But the broader luxury resale market is improving, suggesting builders should not assume the opportunity at the top has disappeared.
Lower prices still reflect the composition change
The median new-home price was $400,400 in September, up 3.9% from August but 3.9% below a year ago. The average price was $472,800, up 0.4% from August and 6.7% below a year ago. Census also revised August’s median down to $385,400, the lowest since July 2021.
Over the past three months, the median is down about 4% from a year earlier and the average about 3%. But these numbers describe the homes that sold, not what the same home costs over time. Lower reported prices therefore reflect changes in the mix of homes being sold as well as any actual price reductions.
That distinction matters because builders have deliberately changed what they offer. Smaller homes on smaller lots help bring the purchase price down, while incentives reduce the cost of financing or closing on a home. Buyers are responding to those adjustments, especially below $400,000.
Fewer finished-home sales reflect last year’s pullback in construction
There were 476,000 new homes for sale at the end of September, 1% fewer than in August and 2.3% fewer than a year ago. At the current sales pace, that represents 8.4 months of supply, compared with 8.2 months a year earlier. Roughly six months of supply is commonly seen as balanced, so buyers still have plenty of choice.
On a three-month average basis, inventory remains about 65% above its 2016–2019 level. But the headline inventory number hides an important change. Fewer of the homes available for sale are finished and ready for buyers to move into.
The more telling shift is in what kind of home is for sale and what kind is selling.
| Stage of construction | For sale, Sep. 2025 | For sale, Sep. 2026 | Sales pace, Sep. 2025 | Sales pace, Sep. 2026 |
|---|---|---|---|---|
| Completed | 122k | 111k (−9%) | 428k | 380k (−11%) |
| Under construction | 262k | 250k (−5%) | 216k | 214k (−1%) |
| Not yet started | 103k | 115k (+12%) | 70k | 82k (+17%) |
The decline in finished-home sales reflects the pullback in homebuilding last year. Builders started fewer homes, and that slowdown is now showing up in completions. Single-family completions fell to an 840,000 annual pace in September, down 11% from a year earlier. Completions are also down about 11% so far this year.
With fewer homes being completed, there are fewer move-in-ready homes available for sale. Finished-home inventory fell 9% from a year ago, reaching its lowest level since late 2024. Sales of completed homes also fell 11%. The decline in sales is therefore occurring alongside a contraction in the supply of finished homes, not simply a disappearance of buyers.
Meanwhile, the pipeline is moving in the opposite direction. There were 115,000 homes for sale that had not yet been started, up 12% from a year ago and the highest level in data going back to 1999. About three of every four homes counted as inventory are not finished.
Yet buyers kept purchasing homes. Sales of homes not yet started increased 17% from a year ago, even as sales of completed homes declined. That suggests some buyers are willing to commit to a home before construction begins rather than wait for finished inventory to become available.
There are good reasons why that might make sense. Builders have been offering smaller, less expensive homes and using price cuts and incentives to close deals. Buyers who purchase before construction begins may also have more flexibility to select the floor plan and home finishings that fit their budget.
What this means for homebuilders
The new-home market held steady in September, but it is softer than a year ago. The encouraging news is that buyers are still willing to transact when the price works. Builders have been doing much of the adjusting by offering smaller homes, lower prices and financial incentives. That strategy is helping support sales at the lower end of the market.
The data point to three opportunities.
Keep feeding the entry level, and finish more homes
Sales are holding up best below $400,000, where affordability improvements can make the biggest difference. But fewer completed homes are available, and sales of finished homes have declined alongside completions. Builders who can deliver move-in-ready homes at these price points may capture buyers who cannot or do not want to wait months for construction.
The increase in sales of homes not yet started is also encouraging. It suggests some buyers are willing to wait when builders offer the right product and terms. That gives builders an opportunity to secure sales earlier in the construction process, even in a difficult affordability environment.
Don’t abandon the high end
Sales of new homes priced between $600,000 and $1 million are down 13% this year, and million-dollar homes fell to 4% of September sales. Some of that weakness may reflect builders shifting production toward cheaper homes rather than a collapse in demand for expensive properties. The Census data do not identify how much of the decline comes from supply versus demand.
The broader resale luxury market offers another perspective. Luxury sales rose about 2% over the past year, while the number of luxury shoppers increased about 3%. At the same time, luxury owners are listing about 7 homes for every 100 luxury homes, down from 11 in 2019.
That leaves relatively few existing luxury homes available for buyers. New construction could help fill the gap, especially in markets where luxury demand is holding up and resale supply remains tight.
Go where luxury supply is thinnest
Seven of the 10 hottest luxury housing markets for 2027 are in the Midwest: Indianapolis, St. Louis, Cleveland, Chicago, Milwaukee, Detroit and Columbus. Luxury listings are down roughly half from 2019 in most of these markets. Luxury prices rose 11% in Indianapolis and 13% in St. Louis over the past year.
That combination creates an opportunity for builders who can deliver the right high-end product. A builder offering luxury new homes in a market with limited resale competition may find buyers who have few existing homes to choose from. Of course, local construction costs, land availability and buyer preferences still matter.
The bottom of the market is congested. It is where most buyers and where most homes for sale are. The top is where the most affluent buyers often have the fewest choices. Builders focused only on entry-level homes could be overlooking opportunities in undersupplied luxury markets.
Sources
- U.S. Census Bureau and HUD, Monthly New Residential Sales, September 2026 (CB26-174, released October 27, 2026), and release tables 1a/1b, 2b and 3a/3b.
- U.S. Census Bureau, Survey of Construction historical series (sold, for sale, price, price range and stage of construction), downloaded October 27, 2026.
- National Association of Home Builders, September 2026 NAHB/Wells Fargo Housing Market Index, builder incentives and price reductions.
- Freddie Mac Primary Mortgage Market Survey, via Trading Economics (September 24 and October 1 readings), The Mortgage Reports (October 15) and Freddie Mac’s October 22 release.
- U.S. Census Bureau and HUD, Monthly New Residential Construction, September 2026 (CB26-162, October 20, 2026), single-family completions; year-to-date change via Scotsman Guide.
- Orphe Divounguy, The 10 Hottest Luxury Housing Markets for 2027 (October 3, 2026).
- Previous report: August 2026 New Home Sales.