Producer Prices Posted Their Biggest Jump Since 2022. The Fed Should Hold, but It’s a Close Call.

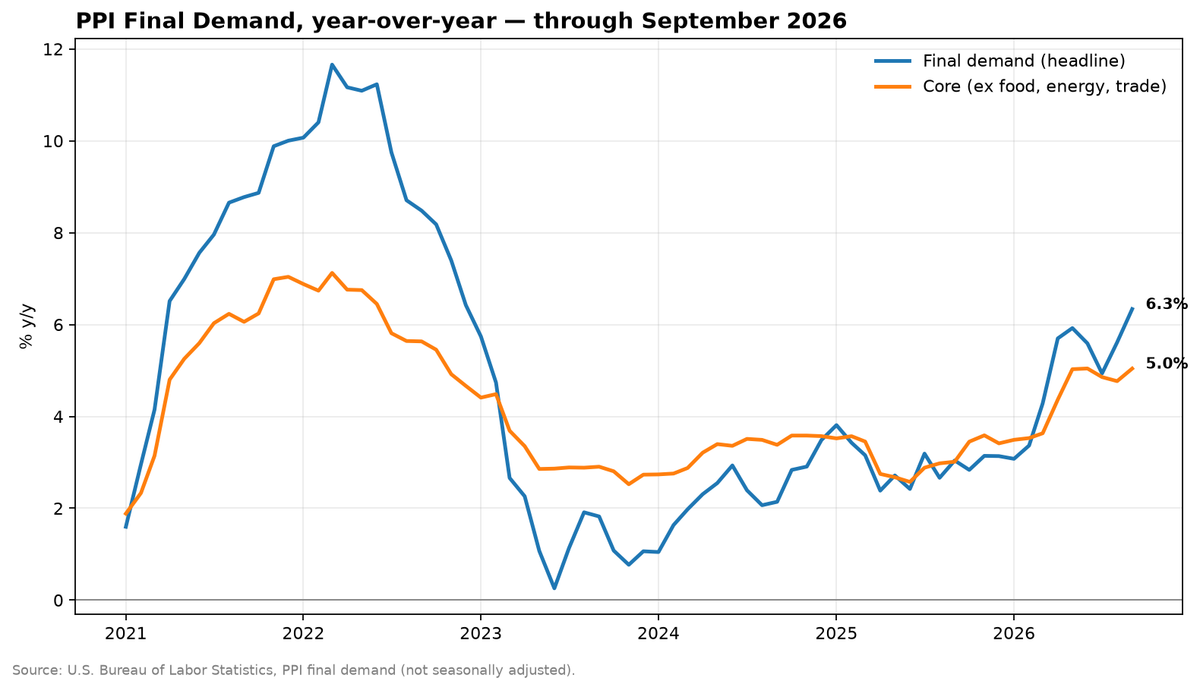
Wholesale prices jumped in September, led by energy. My nowcasts put the Fed’s preferred inflation gauge at 3.6% overall and 3.0% excluding food and energy. The gap is consistent with energy pushing headline inflation higher while core inflation stays near 3%. The PCE price index will be released on October 29.
Key Takeaways
- The biggest jump since March 2022. Producer prices for final demand rose 1.3% in September, well above the 0.5% economists expected, and 6.3% over the year.
- Energy accounted for about half. By my estimate using BLS weights, energy contributed about 0.69 percentage points of September’s 1.34% increase. Transportation and warehousing prices also rose sharply, consistent with higher fuel costs working through the economy, although the data don’t isolate fuel’s share. Store and wholesale margins added about 0.27 points.
- The remaining categories rose more slowly. Goods excluding food and energy, services excluding trade, transportation and warehousing, and construction together account for about 64% of final demand. They contributed only about 0.16 percentage points to September’s increase. Each category’s September increase was below its July–September average pace.
- The Fed’s gauge splits in two. My models nowcast headline PCE at +0.48% for September, lifting the annual rate to about 3.6% from 3.4%. Core PCE, which excludes food and energy, rises about 0.27% month-over-month and holds near 3.0% year-over-year. Despite the hotter than expected print, the probability of an October rate hike fell slightly on the news according to CME FedWatch.
What happened
Producer prices jumped in September. The index for final demand rose 1.3%, with goods up 2.6% and services up 0.8%. Only March 2022 saw a larger monthly increase since the series began in 2009.
Fuel led the way. Goods prices posted their largest increase on record, and half of it came from gasoline, which rose 20.3% in the month. Diesel, jet fuel, crude oil, and residential electricity also rose.
To see what drove the increase, I split it into its seven parts. Each part’s contribution is its share of the index times its price change. The shares come from BLS’s published weights, updated each month the way BLS does. The parts add up to 1.36%, within 0.02 points of the published 1.34%.
| Component | Share of index | September change | Contribution | Share of increase |
|---|---|---|---|---|
| Energy | 6.4% | +10.8% | 0.69 pts | ~52% |
| Store and wholesale margins | 19.3% | +1.4% | 0.27 pts | ~20% |
| Transportation and warehousing | 5.1% | +3.4% | 0.18 pts | ~13% |
| Services excluding trade and transportation | 42.9% | +0.25% | 0.11 pts | ~8% |
| Food | 5.2% | +1.2% | 0.06 pts | ~5% |
| Goods excluding food and energy | 18.4% | +0.27% | 0.05 pts | ~4% |
| Construction | 2.6% | +0.03% | 0.00 pts | ~0% |
Energy was about half of the increase. In the PPI, energy includes electricity and natural gas as well as gasoline, diesel, and jet fuel, so not all of it is oil. But petroleum products led the September jump.
Transportation and warehousing rose 3.4%. Trucking and airline fares were among the gainers. Fuel is a major cost for carriers, so this increase is consistent with energy costs moving through the supply chain. The category also includes passenger travel and storage, though, and the data can’t separate out fuel’s role.
Store and wholesale margins are what retailers and wholesalers earn on top of what they pay for goods. Nearly half of the services increase came from a 1.4% rise in these margins. This series swings a lot from month to month. It fell 2.7% in May and rose 1.3% in June. One strong month doesn’t tell us much.
The remaining categories rose more slowly. Goods excluding food and energy, services excluding trade, transportation and warehousing, and construction together account for about 64% of final demand. They contributed only about 0.16 percentage points to September’s increase. Each category’s September increase was below its July–September average pace:
| Category | September, annualized | Three months through September, annualized |
|---|---|---|
| Goods excluding food and energy | 3.3% | 3.5% |
| Services excluding trade and transportation | 3.1% | 3.9% |
| Construction | 0.4% | 9.3% |
The chart below shows the same breakdown for every month this year. Energy was the largest positive contributor in March, April, May and September. Falling energy prices then subtracted from the index in June and July.

That doesn’t make the report harmless. Every standard measure that strips out energy accelerated:
| Producer prices, 12-month change | August (revised) | September |
|---|---|---|
| Excluding energy | 4.5% | 4.7% |
| Excluding food and energy | 4.8% | 5.0% |
| Excluding food, energy, and trade margins | 4.8% | 5.0% |
Each rose by roughly 0.16 to 0.27 percentage points. But all three still include transportation and warehousing, and two include margins, so they pick up part of the energy shock and part of a volatile series. Excluding energy, prices rose 0.7% in September and have risen at about a 4.9% annual pace over the past three months.

A recent St. Louis Fed analysis by Fernando Martin argues for measuring inflation “excluding energy goods.” His point is that energy goods are far more volatile than anything else in the price indexes, because they track oil prices closely. My PPI measure excluding energy also removes electricity and natural gas, which Martin’s preferred PCE measure keeps, so the comparison is useful but not exact. He also notes that core inflation rose in 2026 alongside the oil shock, which suggests some pressures may not fade when oil markets settle.
That warning is worth taking seriously, and September’s report doesn’t rule it out. What the breakdown does show is that the increase was concentrated: energy, transportation, and margins did most of the work, while goods excluding food and energy, services excluding trade, transportation and warehousing, and construction rose more slowly than their July–September average pace.
What it means for households
Households are falling behind. Wages grew 3.0% over the past year while consumer prices rose 3.7%.
Pump prices are easing, but not by much. EIA put regular gasoline at $4.465 a gallon on September 28 and $4.331 on October 12. That is still $1.27 more than a year earlier.
There is also a risk that gas prices stay high. Gas stations’ margins on fuel fell 30.3% in September. In other words, stations paid much more at wholesale and absorbed part of the increase instead of passing it all to drivers. If wholesale prices stay high, stations will try to rebuild those margins.
Borrowing is more expensive too. Treasury yields have risen and the average 30-year mortgage rate was 7.46% on October 13, according to Mortgage News Daily.
And the job market is stable but weak. Employers added only 29,000 jobs in September, hiring remains low and average hourly earnings growth is slowing. Families are paying more for fuel, paying more to borrow, and finding it harder to get a raise or a new job.
What it means for the Fed decision later this month
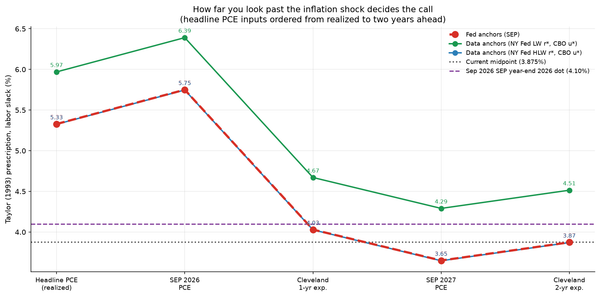
The Fed raised its target range to 3.75%–4.00% on September 16. It meets again October 27–28. September PCE, the Fed’s preferred inflation gauge, comes out October 29, the day after the decision. So this week’s consumer and producer price reports are the Fed’s best real-time read on that gauge.
First, a check on last month’s forecast. In my August post, published September 11, the model estimated August core PCE at +0.22%. BEA later reported +0.25%, with core PCE up 3.0% from a year earlier.
For September, the models nowcast:
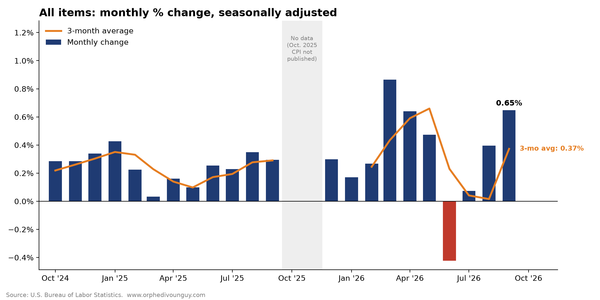
- Headline PCE: +0.48% (approximate 80% range based on past forecast errors: +0.40% to +0.56%). In August, headline PCE was up 3.4% from a year earlier. A 0.48% September would lift it to about 3.6%, with the three-month annualized pace at 3.4%. This is the measure households feel at the pump, and it is moving the wrong way.
- Core PCE: +0.27% (approximate 80% range: +0.18% to +0.37%). Core was up 3.0% in August. The September 2025 reading that drops out of the calculation was about +0.23%, so a +0.27% September leaves core at about 3.0%. Revisions had left core’s three-month annualized pace at 2.0% through August. A +0.27% September would raise it to about 2.6%: the wrong direction, but still below the annual rate.
The gap between the two is consistent with energy pushing headline inflation higher while core inflation stays near 3%.

The case for a hike is serious. Several things point toward one:
- Prices excluding energy rose 0.7% in September, and their three-month pace is near 5%. Margins and food added to the increase, not just energy-linked categories.
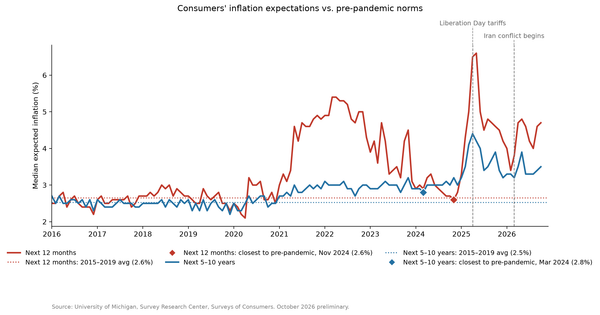
- Year-ahead inflation expectations in Michigan’s survey have risen to 4.7%.
- Headline inflation shapes what households expect. A rise to 3.6%, with gasoline the most visible price in the economy, is exactly the kind of increase that can pull expectations up even if core stays put.
- The policy rate is only modestly above current headline inflation. That alone doesn’t tell us how restrictive policy is: the answer depends on where inflation is expected to go and on the neutral interest rate, both of which are uncertain. Rising household expectations make that judgment harder.
- After five years of inflation above 2%, the Fed can’t count on people expecting it to come back down. When expectations are less settled, there is less room to look past a supply shock. That is a central lesson of research on oil shocks and on the 2021–23 inflation.
Why I still favor holding in October:
- The increase was concentrated. Energy accounted for about half of September’s producer-price jump. Transportation and margins added another third. Goods excluding food and energy, services excluding trade, transportation and warehousing, and construction together account for about 64% of final demand. They contributed only about 0.16 percentage points to September’s increase, and each category’s September increase was below its July–September average pace. That concentration is consistent with an energy cost shock moving through the supply chain. It offers less evidence of a broad acceleration in producer prices.
- Timing. Financial conditions respond right away, but much of a hike’s effect on spending and inflation would arrive later. Pump prices are already falling. If the energy shock fades, the Fed would be squeezing demand just as the energy push reverses, in a weak job market.
- Waiting buys information. The September hike hasn’t fully worked through yet. Before the December meeting, the Fed will see September PCE on October 29, October CPI on November 10, and October PPI soon after. Waiting carries risks if inflation expectations keep rising, but a hike into a stalling job market is harder to undo.
What would change my view. Hold in October, but say clearly what would justify a December hike:
- Prices excluding energy rise 0.5% or more again in October, with the increase coming from somewhere other than transportation and margins.
- Core services prices pick up.
- Longer-run inflation expectations keep rising.
Those developments would strengthen the case for a December hike, and the Fed should say so now so markets don’t have to guess.
Hold now, set the triggers, and let the next round of data decide.
Sources. U.S. Bureau of Labor Statistics, Producer Price Index — September 2026 (October 15) and August 2026 (September 10), including Table 1 relative-importance weights; Consumer Price Index — September 2026 (October 14). U.S. Bureau of Economic Analysis, Personal Income and Outlays, August 2026, including the annual update (September 30); September release scheduled for October 29. Federal Reserve, FOMC statement and minutes, September 15–16, 2026. CME FedWatch. University of Michigan Surveys of Consumers, preliminary October 2026. Mortgage News Daily, October 13, 2026. U.S. Energy Information Administration, Gasoline and Diesel Fuel Update. Fernando M. Martin, “Between Headline and Core: Inflation Excluding Energy Goods,” St. Louis Fed On the Economy, July 15, 2026. Forecast evaluation: Diebold and Mariano (1995), Journal of Business & Economic Statistics; Harvey, Leybourne and Newbold (1997), International Journal of Forecasting. Contributions to the PPI change and headline and core PCE nowcasts are the author’s estimates from BLS and BEA data via FRED; nowcast ranges are approximate, based on past out-of-sample forecast errors, and are not official forecasts.