September 2026 Housing Market Report: Sellers Stay While Buyers Pull Back

Pending sales fall to their lowest level since April 2020
Key Takeaways
- Buying activity weakened. Pending sales fell 8.6% from a year earlier and 4.0% from August, the largest monthly decline since March 2023.
- Inventory increased as buyers pulled back. Active listings, the number of homes for sale at any point in the month, increased 1.2% from August to 1.51 million, the most since March 2020. New listings held roughly steady.
September’s housing slowdown went beyond the usual seasonal pullback. After adjusting for seasonal patterns, 316,652 homes went under contract, the lowest level since April 2020. Closed sales fell to 282,433, their lowest level since December 2023.
New listings increased just 0.3% from August and were down 0.4% from a year earlier. Yet active listings rose 1.2% to 1.51 million homes, the most since March 2020. Fewer contract signings left more homes available for sale.

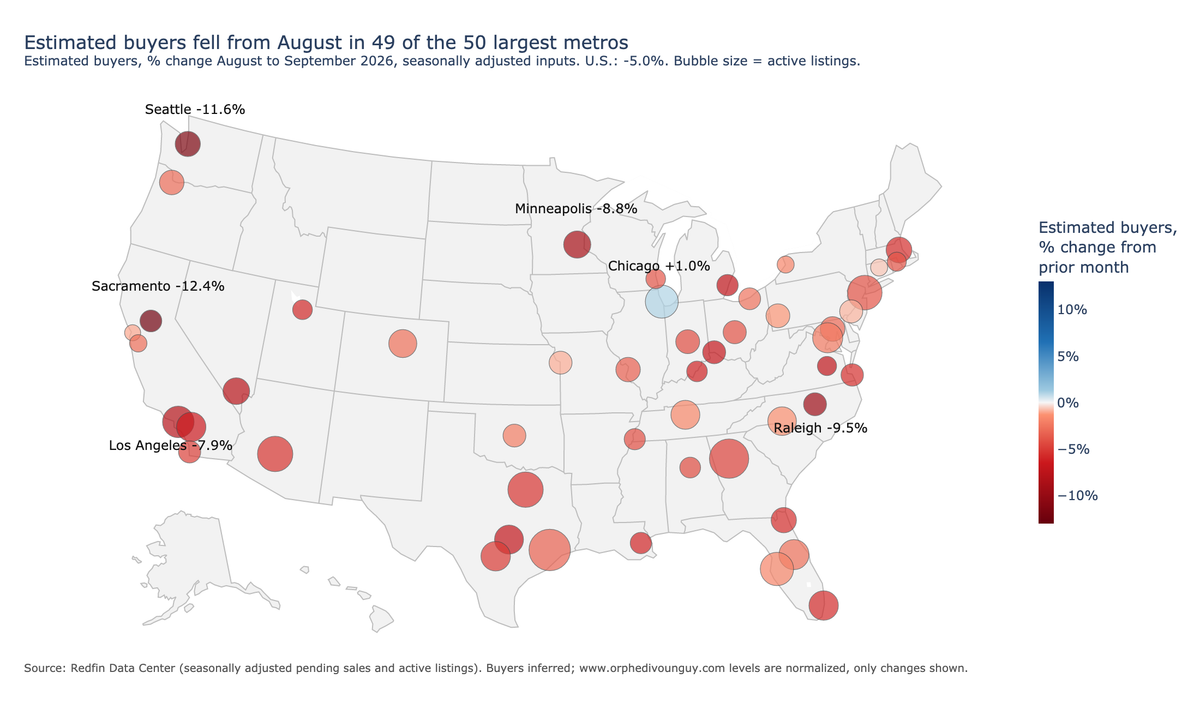
The estimated buyer pool fell 10.5% from a year earlier and 5.0% from August. The estimated number of buyers was 24% below September 2019’s level, while active listings were only 6% below the pre-pandemic level. Pending sales declined from a year earlier in all 50 of the largest markets.
Buyers have more choice and face less competition. But more homes on the market do little for households that cannot afford the monthly payment.
National Market Details
Inventory and New Listings
Active listings, the number of homes for sale at any point during the month, totaled 1,510,784, up 1.7% from a year earlier and 1.2% from August. That was the highest level since March 2020, and the monthly increase was the largest since March 2025.
New listings totaled 381,191, down 0.4% from a year earlier, up 0.3% from August and 8% below September 2019. Active listings remained 6% below September 2019.
Sales
Closed sales fell 4.3% from a year earlier and 1.6% from August. Pending sales fell 8.6% annually and 4.0% monthly. Compared with September 2019, closed sales were down 20% and pending sales were down 22%.
Competition
Homes going under contract spent a median of 51 days on the market, two days longer than a year earlier and one day longer than in August.
Active listings were equivalent to 4.8 months of September’s contract signings, up from 4.3 a year earlier and 4.5 in August. This ratio was the highest since November 2015.
Buyers
The 10.5% annual decline in the estimated number of home buyers was the steepest since August 2023. The 5.0% monthly decline was the largest since March 2023. Listings available at any point during September increased about 14% relative to the estimated buyer pool from a year earlier. Seattle had the largest annual buyer decline among the 50 markets covered, at 31%.
Multifamily Homes with Two to Four Units
Active listings reached 50,353, up 8.3% annually and 2.5% above September 2019, the most for any September since 2018.
Pending sales totaled 8,147, down 11.5% annually. Closed sales of 6,938 were the fewest for any September since 2013. Estimated buyers fell 14.9% annually and were 26% below September 2019.
September Results for 50 Large Housing Markets
All homes. Redfin uses metropolitan divisions where available, so New York excludes Newark and Nassau County, and Los Angeles excludes Anaheim.
| Market | Active listings y/y | Active listings vs. Sept. 2019 | Pending sales y/y | Est. buyers y/y | Est. buyers vs. Sept. 2019 |
|---|---|---|---|---|---|
| United States | +1.7% | −6% | −8.6% | −10.5% | −24% |
| New York, NY | −0.1% | −35% | −14.9% | −17.4% | −18% |
| Los Angeles, CA | 0.0% | −6% | −16.0% | −18.7% | −43% |
| Chicago, IL | −0.9% | −41% | −5.8% | −6.7% | −17% |
| Dallas, TX | −5.7% | +24% | −14.5% | −16.1% | −29% |
| Houston, TX | +1.6% | +30% | −10.7% | −12.8% | −23% |
| Washington, DC | +9.9% | +4% | −10.8% | −14.3% | −41% |
| Philadelphia, PA | +11.6% | +1% | −7.5% | −10.8% | −34% |
| Miami, FL | −12.5% | −12% | −2.7% | −0.7% | −24% |
| Atlanta, GA | −0.6% | −2% | −13.9% | −16.2% | −46% |
| Boston, MA | +18.3% | −13% | −10.7% | −15.4% | −40% |
| Phoenix, AZ | −0.3% | +22% | −9.8% | −11.5% | −45% |
| San Francisco, CA | −11.4% | −23% | −7.9% | −7.2% | −16% |
| Riverside, CA | −6.0% | −18% | −13.5% | −14.9% | −40% |
| Detroit, MI | 0.0% | −12% | −10.7% | −12.6% | −24% |
| Seattle, WA | +22.9% | +17% | −24.4% | −31.1% | −51% |
| Minneapolis, MN | +8.5% | −6% | −12.3% | −15.7% | −33% |
| San Diego, CA | −2.1% | −22% | −15.8% | −18.2% | −46% |
| Tampa, FL | +4.6% | +19% | −5.3% | −7.1% | −39% |
| Denver, CO | +0.4% | +23% | −13.8% | −16.3% | −41% |
| Baltimore, MD | +8.3% | −25% | −7.6% | −10.4% | −33% |
| St. Louis, MO | +11.3% | −15% | −4.8% | −7.6% | −18% |
| Orlando, FL | +6.1% | +31% | −5.5% | −7.5% | −33% |
| Charlotte, NC | +3.1% | +10% | −7.5% | −9.3% | −32% |
| San Antonio, TX | −0.6% | +43% | −6.2% | −7.2% | −22% |
| Portland, OR | +1.2% | +1% | −11.9% | −14.2% | −39% |
| Sacramento, CA | −1.0% | −7% | −12.0% | −14.0% | −44% |
| Pittsburgh, PA | +6.3% | −17% | −2.1% | −3.7% | −14% |
| Austin, TX | −0.1% | +70% | −4.4% | −5.2% | −33% |
| Las Vegas, NV | −0.3% | −6% | −10.9% | −12.8% | −47% |
| Cincinnati, OH | +9.3% | −20% | −6.8% | −9.6% | −28% |
| Kansas City, MO | −1.6% | −15% | −3.3% | −3.7% | −17% |
| Columbus, OH | +4.8% | −2% | −7.1% | −9.2% | −22% |
| Indianapolis, IN | +7.8% | +12% | −9.4% | −12.4% | −23% |
| Cleveland, OH | +8.7% | −30% | −7.1% | −9.9% | −18% |
| San Jose, CA | +19.4% | −30% | −3.5% | −7.4% | −42% |
| Nashville, TN | +10.0% | +19% | −3.6% | −6.0% | −33% |
| Virginia Beach, VA | +2.8% | −24% | −3.7% | −4.9% | −14% |
| Providence, RI | +10.9% | −39% | −10.2% | −13.8% | −41% |
| Jacksonville, FL | −13.8% | +3% | −10.2% | −9.5% | −16% |
| Milwaukee, WI | +4.5% | −23% | −3.0% | −4.4% | −18% |
| Oklahoma City, OK | +3.8% | +30% | −6.4% | −8.2% | −18% |
| Raleigh, NC | +6.5% | −2% | −14.5% | −18.0% | −32% |
| Memphis, TN | +5.7% | +19% | −2.7% | −4.2% | −21% |
| Richmond, VA | +0.6% | −20% | −9.4% | −11.2% | −23% |
| Louisville, KY | +12.8% | +6% | −9.4% | −13.1% | −27% |
| New Orleans, LA | −2.0% | +7% | −7.9% | −8.9% | −28% |
| Salt Lake City, UT | +13.1% | +21% | −9.9% | −13.7% | −47% |
| Hartford, CT | +1.8% | −59% | −2.4% | −3.2% | −44% |
| Buffalo, NY | +21.0% | −6% | −5.8% | −10.2% | −20% |
| Birmingham, AL | +0.1% | −11% | −9.9% | −11.7% | −44% |
About the Data
Housing data. Redfin Data Center monthly data through September 2026. All-home activity metrics use Redfin’s seasonal adjustment. The multifamily series uses observations explicitly marked as not seasonally adjusted. Redfin revises historical data as information arrives.
Inventory and listings. Inventory measures listings active on the final day of the month. Active listings measures homes available at any point during the month. The report uses active listings for all supply measures and the buyer model; end-of-month inventory is used only in the inventory-flow residuals. These are distinct measures.
Historical comparisons. Adjusted activity levels and monthly changes are compared across all prior months. Unadjusted levels and monthly changes are compared with the same calendar month or transition in earlier years. Annual percentage changes are compared across all prior months. The housing series begin in January 2012.
Estimated buyers. We infer a normalized buyer index from pending sales and active listings using a constant-returns Cobb–Douglas matching function. The listings elasticity is 0.16, following Genesove and Han (2012), and matching efficiency is normalized to one and held constant over time. Changes are conditional on that assumption. The estimates are distinct from Redfin’s published buyer estimates.
Inventory-flow residuals. The dataset includes new listings minus pending sales minus the monthly change in inventory, and a version using closed sales. These are calculated residuals, not observed withdrawals. They can capture returns to market, coverage differences, revisions and seasonal-adjustment discrepancies; the closed-sales version also reflects closing lags.
Coverage. The September panel includes 945 all-home metro regions and 860 multifamily regions. Markets with fewer than 20 closed sales or 50 active listings, or missing values for either, are flagged as thin. National coverage and historical comparisons are separate from the selected 50-market table. The October report will follow Redfin’s scheduled November 10 release.
Sources
Redfin Data Center and methodology: https://www.redfin.com/news/data-center/ and https://www.redfin.com/news/data-center/methodology/
Genesove, D., and Han, L. (2012). Search and matching in the housing market. Journal of Urban Economics, 72(1), 31–45. https://doi.org/10.1016/j.jue.2012.01.002