I Favored a Fed Pause. The Case for Another Hike Is Getting Stronger, but the Fed Can Wait Until December.

Most policy rules point to higher interest rates, even after allowing for inflation to decline. The case for further tightening is strong, but the Fed should move gradually and adjust the pace as the evidence changes.
Key Takeaways
- Current inflation points to higher rates. Standard Taylor and balanced-approach rules put the funds rate at 5.33%–6.16% using unemployment to measure slack. Using the latest CBO output gap raises the upper estimate to about 7.2%. A rule that moves rates gradually stays inside today’s range in the labor-market scenarios shown.
- The Fed’s rate path leaves room for inflation to fall. With the Fed’s longer-run assumptions and current unemployment, today’s rate fits the Taylor rule at about 2.45% inflation. The rounded year-end rate projection fits about 2.60%, well below August’s 3.42% PCE inflation reading.
- The timing matters. Assuming policy looks a year ahead and the inflation gap shrinks at a constant proportional rate, those rate settings correspond to half the overshoot fading in roughly eight and eleven months.
- Higher real borrowing costs support a gradual approach. Between September 15 and October 15, the 10-year Treasury yield rose 10 basis points as real yields increased 16 basis points and inflation compensation fell six basis points. That adds restraint and gives the Fed a reason to assess the effects before raising rates again. Broader inflation or rising longer-term expectations would strengthen the case for moving faster.
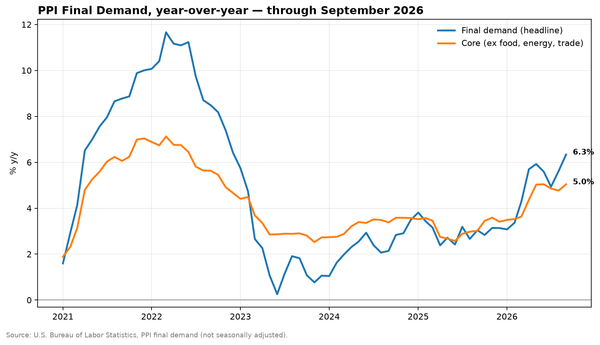
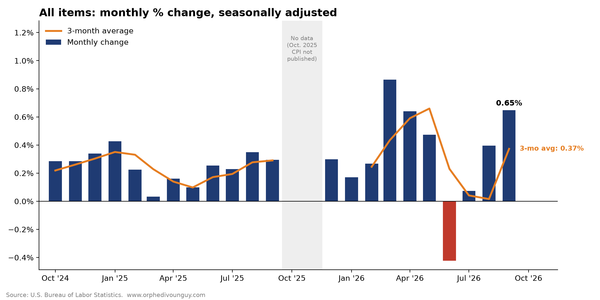
The Fed expects inflation to remain elevated this year before falling sharply in 2027. Its September projections put headline PCE inflation at 3.7% in 2026 and 2.3% next year. Meanwhile, the median rate projection stays near 4.1% in both years, slightly above today’s 3.75%–4.00% range.
That raises an important question: how much of the expected decline in inflation is already reflected in the Fed’s policy rate path? I compared several policy rules to see what today’s data and the Fed’s own forecasts would imply for the policy rate.
These results make me more open to further tightening. The question is how quickly the Fed should move. Higher real borrowing costs are already adding restraint as the economy absorbs an oil shock. As Bernanke explained in Oil and the Economy, higher energy prices squeeze spending while pushing inflation up, so an aggressive response risks deepening the slowdown. I favor moving gradually and accounting for the tightening already underway. Holding in October and reconsidering in December would give policymakers more evidence without taking another hike off the table.
What the rules say about rates today
Taylor rules offer a simple way to connect interest rates to inflation and economic activity. Inflation above 2% pushes the prescribed rate higher. A weaker labor market pulls it lower.
With unemployment at 4.2%, matching the Fed’s longer-run estimate, the employment adjustment is zero. August’s 3.42% headline PCE inflation therefore drives the result. Using a 1.2% neutral real rate, derived from the Fed’s 3.2% longer-run funds rate minus its 2% inflation target, the standard Taylor rule puts the funds rate at 5.33%.
| Rule | Prescribed funds rate | Versus today’s 3.75%–4.00% range |
|---|---|---|
| Taylor (1993) | 5.33% | Above |
| Balanced approach | 5.33% | Above |
| Stronger inflation response | 6.04% | Above |
| Gradual adjustment (inertial balanced approach) | 3.95% | Inside |
Other variants, including rules that respond only to employment shortfalls or add a response to longer-run inflation expectations, give 4.78%–5.48% under the same Fed anchors. A price-level makeup rule gives a much higher rate because it seeks to reverse accumulated departures from a 2% path since December 2019. That is a different strategy, sensitive to its starting point and the treatment of missing observations, and does not guide my October call.
The balanced rule puts the funds rate at 5.33%, but the gradual-adjustment version moves only partway toward that prescription each month. This version closes about 5% of the gap each month. Starting from today’s 3.875% midpoint, that means an increase of roughly 8 basis points, bringing the rate to 3.95%. That is still inside the current 3.75%–4.00% range. The distinction matters: the rule points toward more restraint over time, but its immediate prescription does not require another quarter-point hike.
This rule does not explicitly account for the recent rise in market yields.
There is also a market-based reason to move carefully. Between September 15 and October 15, the 10-year Treasury yield rose from 5.00% to 5.10%. Real yields increased 16 basis points while inflation compensation fell six. The rise therefore reflects higher real borrowing costs, rather than an increase in market inflation compensation. That is consistent with additional restraint on spending and investment.
This tightening deserves weight in the decision about the next hike. It does not prove that markets have done all the work: yields could still fall if anticipated hikes fail to materialize. But the Fed should account for the pressure already coming from financial markets when deciding how quickly to add more.
The assumptions about neutral interest rates and longer-run unemployment also make a difference. Across the standard Taylor and balanced rules using labor-market slack, current inflation puts the funds rate at 5.33%–6.16%. Using the CBO output gap, carried forward from the second quarter, raises the top estimate to 7.18%.
How far ahead policymakers look changes the answer
Monetary policy takes time to work. If the inflation pressure coming from energy prices was already headed lower, reacting only to the latest reading could lead the Fed to tighten more than necessary.
Keeping current unemployment and the Fed’s longer-run assumptions unchanged, I substituted expected inflation for the latest reading in the standard Taylor rule.
| Inflation input | Inflation rate | Prescribed funds rate |
|---|---|---|
| August headline PCE | 3.42% | 5.33% |
| Fed’s 2026 headline PCE projection | 3.70% | 5.75% |
| Cleveland one-year expectations, approximately adjusted to a PCE basis | 2.55% | 4.03% |
| Fed’s 2027 headline PCE projection | 2.30% | 3.65% |
| Cleveland two-year average expectations, approximately adjusted to a PCE basis | 2.45% | 3.87% |
Cleveland estimates are adjusted from CPI to an approximate PCE basis and cover average inflation over the next one or two years. The Fed’s projections measure fourth-quarter-to-fourth-quarter inflation. The table compares alternative inputs rather than tracing one forecast path.
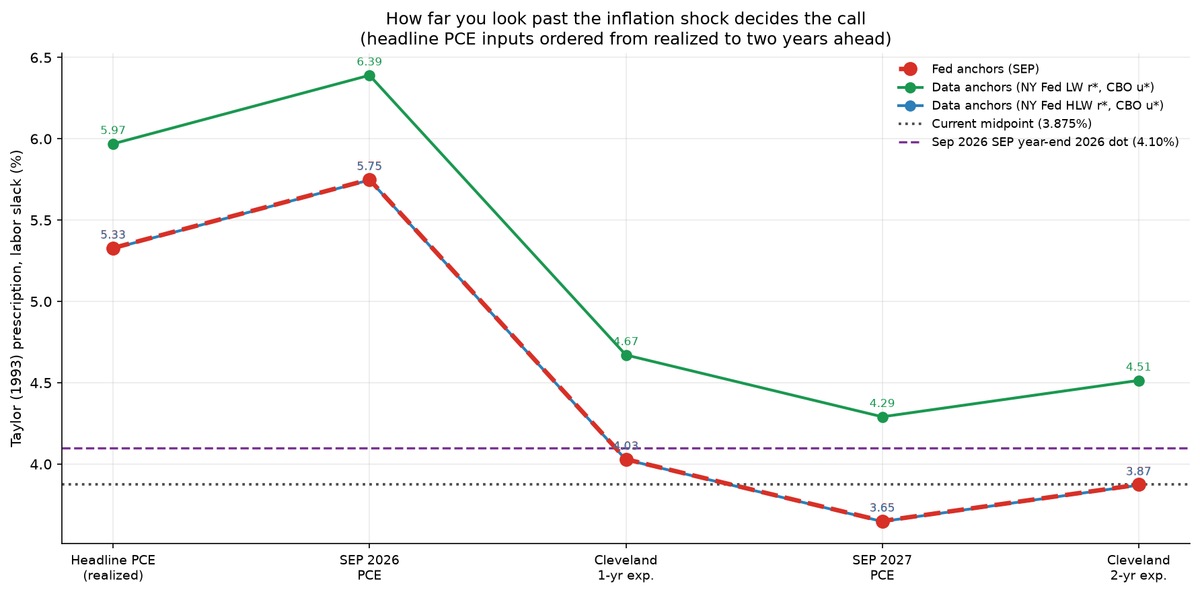
The one-year ahead estimate brings the prescription down to 4.03%, barely above today’s range. The two-year ahead estimate puts it at 3.87%, almost exactly today’s midpoint. How far policymakers look beyond the shock makes a substantial difference.
A higher neutral rate leaves less room to wait. Using the New York Fed’s Laubach–Williams estimate alongside CBO’s noncyclical unemployment rate raises the one-year prescription from 4.03% to 4.67%.
Even after allowing for lower expected inflation, 11 of the 18 Taylor and balanced scenarios put rates above today’s range, four inside it and three below. These calculations share inputs and formulas. They show how the answer changes with the assumptions.

What today’s rate says about inflation fading
We can also work backward. What inflation rate would make today’s policy rate fit the Taylor rule?
With the Fed’s longer-run assumptions and current unemployment, today’s 3.875% midpoint fits inflation of about 2.45%. The rounded year-end rate projection of 4.10% fits about 2.60%. Both allow for a substantial decline from last month’s inflation reading of 3.42%.
Viewed through this framework, the Fed is leaving room for much of the inflation overshoot to fade. Another small hike would still be consistent with expecting disinflation. It could accommodate a slower decline without treating the shock as permanent.
To illustrate the timing, I assumed policy responds to inflation a year ahead and the gap above 2% shrinks at a constant proportional rate.
| Policy rate interpreted through the Taylor rule | Inflation input that fits | Illustrative overshoot half-life |
|---|---|---|
| Current midpoint: 3.875% | 2.45% | About 8 months |
| Rounded year-end dot: 4.10% | 2.60% | About 11 months |
Under those assumptions, the current rate corresponds to an inflation-gap half-life of about eight months, compared with eleven months for the year-end dot. The calculation starts with August’s inflation reading and places the forward inflation input 12 months beyond October, allowing for the data lag.

The broad implication is that much of the overshoot unwinds over roughly a year. The higher year-end rate accommodates a somewhat slower pace. Halving the gap, however, is not the same as returning inflation to 2%.
The exercise cannot pin down policymakers’ beliefs directly. The eight- and eleven-month estimates depend on the assumed horizon and decay path; gradual rate adjustment, employment risks and a different neutral rate can also explain policy choices.
The neutral-rate assumption again matters. With the higher Laubach–Williams estimate and CBO’s unemployment anchor, today’s rate fits inflation of only about 2.02%. That version requires inflation to get much closer to target to reconcile the rule with not hiking again.
Looking through energy still leaves some pressure
My inflation decomposition offers another way to examine the case for waiting. In its energy scenario, energy contributes about 0.70 percentage points to the 3.36% headline reading, roughly half the gap above 2%. Removing that contribution leaves 2.66 percentage points. This is a scenario residual, not a separately measured ex-energy inflation rate; the decomposition also uses an earlier vintage than the current 3.42% reading.
Using that residual as an inflation input puts the Taylor-rule rate at 4.19% under the Fed’s assumptions, still above today’s range. Looking through the energy contribution alone does not eliminate the upward signal. Estimated trend inflation is 2.98%, which gives a rate of about 4.66%. The uncertainty around that estimate is wide, so it does not settle the decision.
How the dots compare with the Fed’s outlook
The Fed’s own forecasts help explain why its rate path sits below many of today’s rule prescriptions. Participants expect inflation to decline while unemployment remains low.
The September projections put unemployment at 4.1% in both 2026 and 2027, with headline PCE inflation falling from 3.7% to 2.3%. The median rate projection is about 4.1% in both years.
| SEP outlook used in the rule | Taylor prescription | Balanced prescription | Median rate projection |
|---|---|---|---|
| 2026: inflation 3.7%, unemployment 4.1% | 5.85% | 5.95% | About 4.1% |
| 2027: inflation 2.3%, unemployment 4.1% | 3.75% | 3.85% | About 4.1% |
Unlike the earlier inflation comparison, these calculations use projected unemployment as well as projected inflation. SEP inflation is measured fourth quarter to fourth quarter, and published medians are rounded.
This year’s median rate projection sits 1.75–1.85 percentage points below what the rules prescribe. Next year’s sits 0.25–0.35 points above them. The rate path fits the later, lower inflation outlook much better than the near-term reading.
The chart below separates the assumptions behind that gap. Using today’s inflation and unemployment with the Laubach–Williams neutral rate and CBO unemployment anchor gives a Taylor-rule rate of 5.97%. Substituting the Fed’s longer-run assumptions lowers it to 5.33%.
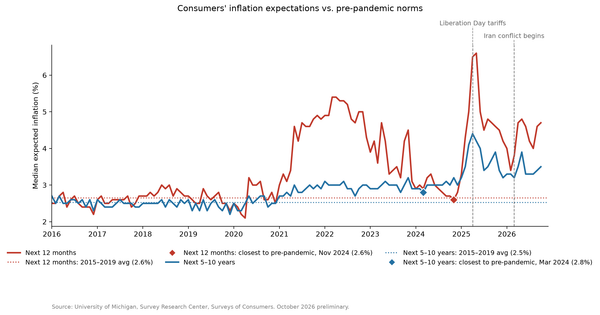
The inflation forecast then separates the two years. Using the 2026 projection raises the prescription to 5.75%; using the 2027 projection lowers it to 3.65%. The Fed’s projected unemployment rate of 4.1% adds another 0.1 point in each case, bringing the final rates to 5.85% and 3.75%.
The message is straightforward: a rate near 4.1% is well below the rule’s prescription on this year’s inflation and slightly above it on next year’s outlook. The difference between the two comparisons comes from expected disinflation.

The projections already tell us that participants expect inflation to fade. These rules show why that decline matters for their rate path. They do not establish that the projections are inconsistent: the Fed uses rules as guides, and the separate medians need not represent any one participant’s forecast.
The expected disinflation may depend partly on further restraint. A year-end dot pointing to another hike does not tell us that inflation will fall with rates unchanged, or that the hike must come in October.
Raise rates gradually and manage the risks
The case for further tightening is strong. Using current inflation, the standard Taylor and balanced rules put rates roughly 1.5–2.3 percentage points above today’s midpoint. Those gaps deserve attention, but they are not instructions to raise rates all at once.
The Fed faces risks on both sides. Waiting too long could allow higher energy costs to spread and inflation expectations to rise. Moving too quickly could compound the squeeze from expensive energy and higher real borrowing costs, weakening spending and employment more than necessary.
I favor gradual tightening as a risk-management approach. Real yields have risen while inflation compensation has declined. That gives the Fed a concrete reason to assess the restraint already reaching households and businesses before adding substantially more.
Holding in October and reconsidering in December would fit that approach. The reason to wait is the tightening already underway—not simply the hope that inflation falls next year. Another hike should remain firmly on the table. If inflation broadens, longer-term expectations rise or market yields fall back, the case for waiting weakens.
The pace should change with the evidence. Clear progress on inflation would support smaller, more widely spaced moves or a stop. Persistent inflation, broader price increases or rising longer-term expectations would strengthen the case for moving faster, potentially by more than 25 basis points.
The aim is to bring inflation down while limiting unnecessary damage to the economy. The rules strengthen the case for higher rates. Risk management should determine how quickly the Fed gets there.