The 10 Hottest Luxury Housing Markets for 2027

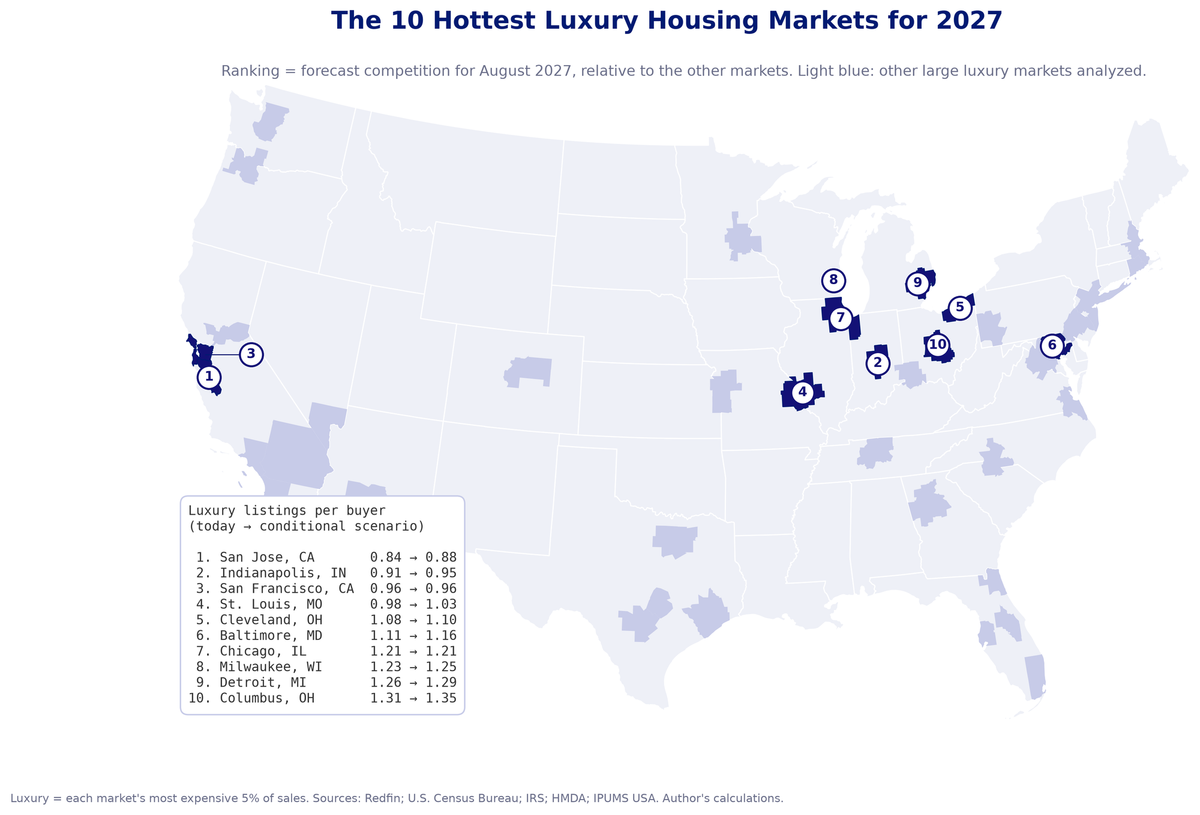
Buyers of high-end homes will face the stiffest competition in the Bay Area and the Midwest, where luxury homes rarely come up for sale.
Key Takeaways
- The Bay Area and the Midwest lead. San Jose, Indianapolis and San Francisco top the list of the 10 hottest luxury markets for 2027, and seven of the 10 are in the Midwest.
- More high earners, fewer luxury buyers. About 11% fewer households are shopping for a luxury home than in 2019, even though the number earning $200,000 or more has grown roughly 23%.
- Supply is the real story. Across the largest markets, about 7 luxury homes came up for sale for every 100 over the past year, down from about 11 in 2019.
- An opening for builders. The hottest markets stay tight because so few luxury homes come up for sale, which points to opportunities for luxury homebuilders.
Luxury buyers have pulled back across most of the country since the pandemic boom. But competition for high-end homes remains stiff in a handful of metros, led by San Jose, Indianapolis and San Francisco. Seven of the 10 hottest luxury markets for 2027 are in the Midwest. The two major Bay Area markets and Baltimore round out the list.
Weak homebuilding and a lack of luxury homes returning to the market set these places apart. Across most of these markets, competition remains high despite fewer luxury buyers than in 2019.
Nationally, we estimate that about 11% fewer households are shopping for a luxury home than in 2019, even as the number earning $200,000 or more has grown roughly 23%. The hottest markets remain tight because so few luxury homes come up for sale. That shortage points to opportunities for luxury homebuilders.
Across the largest housing markets, there were about 7 new listings for every 100 luxury homes over the past year, down from about 11 in 2019. The decline has been especially steep in the markets at the top of this list.
Here’s a look at where we expect luxury buyers to face the stiffest competition in 2027.
The top 10 hottest luxury markets for 2027
We analyzed the largest U.S. housing markets to identify where luxury buyers will face the most competition. We define a luxury home as one in the most expensive 5% of homes sold in each metro. That means the price of a luxury home varies widely: the median was about $865,000 in Cleveland and $5.6 million in San Jose. For each market, we looked at:
- The number of luxury homes for sale for every buyer actively shopping for one, which is the measure we use to rank the markets
- How that balance has changed over the past year
- How many new luxury listings come on the market compared with the number of luxury homes in the area
- Luxury sales, prices and the number of households earning $200,000 or more, which help explain why each market looks the way it does
No public data source counts luxury buyers directly. Our housing model estimates them using how quickly luxury homes go under contract and how long buyers typically search before finding a home. Fewer homes for sale per buyer means more competition. The ranking forecasts which markets will be most competitive in 2027 relative to the others on the list. It does not forecast whether the luxury market as a whole will tighten or loosen next year. That will depend largely on financial wealth and conditions in the global economy.
Most of the hottest markets have far fewer luxury homes for sale than before the pandemic. Listings are down 57% from 2019 in Chicago and 56% in Cleveland. Buyers have more choices in markets near the bottom of the ranking, most of which are in the Sun Belt: Miami, Los Angeles, Atlanta, San Antonio and Austin.

1. San Jose, CA
- Median luxury sale price: $5.62 million, up 3.4% from a year earlier*
- Luxury listings per buyer: 0.84, the fewest of the largest U.S. metros
- There are 39% fewer luxury homes for sale than in 2019, and 15% fewer than a year ago
- 3.8 new luxury listings for every 100 luxury homes over the past year, down from 5.2 in 2019
- Luxury sales fell 8.3% over the past year
- 44.6% of households earn $200,000 or more, the highest share of the largest U.S. metros
In San Jose, high incomes and access to financial wealth support demand, while owners selling infrequently keeps supply tight. More than two in five households earn $200,000 or more, and the few luxury homes that come up for sale attract buyers able to pay well over $5 million. Owners here sell less often than anywhere else we studied, which keeps the market tight.
2. Indianapolis, IN
- Median luxury sale price: $1.04 million, up 11.0% from a year earlier*
- Luxury listings per buyer: 0.91
- There are 50% fewer luxury homes for sale than in 2019
- 6.4 new luxury listings for every 100 luxury homes, down from 10.0 in 2019
- Luxury sales rose 1.6% over the past year
- 12.2% of households earn $200,000 or more
Indianapolis is tight for the opposite reason. A luxury home costs about five years of a $200,000 income, putting it within reach of far more households than in the Bay Area. But luxury listings have been cut in half since 2019. Sellers have noticed: luxury prices rose 11% over the past year.
3. San Francisco, CA
- Median luxury sale price: $4.47 million, up 11.7% from a year earlier*
- Luxury listings per buyer: 0.96, down from 1.18 a year earlier
- There are 38% fewer luxury homes for sale than in 2019, and 11% fewer than a year ago
- 4.1 new luxury listings for every 100 luxury homes, down from 6.0 in 2019
- Luxury sales rose 19.3% over the past year, the biggest gain in the top 10
- 35.7% of households earn $200,000 or more
San Francisco’s luxury market heated up quickly over the past year. The number of luxury buyers rose about 10% while listings fell 11%, leaving more buyers competing for a shrinking pool of homes. Luxury sales jumped 19%.
4. St. Louis, MO
- Median luxury sale price: $1.08 million, up 12.8% from a year earlier, the fastest gain in the top 10*
- Luxury listings per buyer: 0.98
- There are 52% fewer luxury homes for sale than in 2019, although listings rose 6.7% over the past year
- 5.5 new luxury listings for every 100 luxury homes, down from 7.8 in 2019
- Luxury sales rose 4.7% over the past year
- 13.1% of households earn $200,000 or more
St. Louis has about half as many luxury homes for sale as in 2019. Listings increased over the past year, giving buyers a little more breathing room. But the market remains one of the tightest in the country and is expected to stay near the top of the list.
5. Cleveland, OH
- Median luxury sale price: $865,000, up 8.7% from a year earlier*
- Luxury listings per buyer: 1.08
- There are 56% fewer luxury homes for sale than in 2019
- 5.8 new luxury listings for every 100 luxury homes, down from 9.5 in 2019
- Luxury sales rose 3.8% over the past year
- 10.6% of households earn $200,000 or more, the lowest share of the 40 markets
Cleveland is the most affordable luxury market on the list and has the smallest share of high-earning households of any market we studied. Yet luxury homes have nearly vanished from the market. Listings are down more than half since 2019, keeping competition high.
6. Baltimore, MD
- Median luxury sale price: $1.31 million, up 5.8% from a year earlier*
- Luxury listings per buyer: 1.11
- There are 54% fewer luxury homes for sale than in 2019
- 5.5 new luxury listings for every 100 luxury homes, down from 9.9 in 2019
- Luxury sales rose 0.5% over the past year
- 20.6% of households earn $200,000 or more
Baltimore is the only top-10 market outside the Midwest and the Bay Area. Luxury owners are listing their homes at little more than half the rate they did in 2019, keeping the supply of high-end homes thin.
7. Chicago, IL
- Median luxury sale price: $1.62 million, up 8.8% from a year earlier*
- Luxury listings per buyer: 1.21, down from 1.50 a year earlier
- There are 57% fewer luxury homes for sale than in 2019, one of the steepest drops of any market
- 5.4 new luxury listings for every 100 luxury homes, down from 9.7 in 2019
- The number of luxury buyers rose 10.5% over the past year, but luxury sales rose just 0.5%
- 17.6% of households earn $200,000 or more
Chicago offers the clearest example of more affluent buyers competing for a shrinking pool of homes. It is the only top-10 market with more luxury buyers than in 2019. Yet sales barely grew over the past year because the listings just aren’t there.
8. Milwaukee, WI
- Median luxury sale price: $1.16 million, up 6.5% from a year earlier*
- Luxury listings per buyer: 1.23
- There are 52% fewer luxury homes for sale than in 2019, and 7% fewer than a year ago
- 5.6 new luxury listings for every 100 luxury homes, down from 9.0 in 2019
- Luxury sales fell 3.7% over the past year
- 11.9% of households earn $200,000 or more
Milwaukee shows how a market can stay competitive even as activity slows. Luxury sales dipped over the past year, but listings fell faster than the number of buyers, keeping competition high. The homes that did come up for sale still drew plenty of interest.
9. Detroit, MI
- Median luxury sale price: $938,000, up 2.6% from a year earlier*
- Luxury listings per buyer: 1.26
- There are 49% fewer luxury homes for sale than in 2019
- 6.1 new luxury listings for every 100 luxury homes, down from 9.9 in 2019
- Luxury sales were essentially flat over the past year (down 0.4%)
- 12.0% of households earn $200,000 or more
Detroit added fewer high-earning households than any other market on the list, with about 10% more than in 2019. Yet it remains one of the country’s most competitive luxury markets because the number of luxury homes for sale has been cut roughly in half.
10. Columbus, OH
- Median luxury sale price: $1.01 million, up 5.7% from a year earlier*
- Luxury listings per buyer: 1.31
- There are 38% fewer luxury homes for sale than in 2019, although listings rose 6.3% over the past year
- 7.2 new luxury listings for every 100 luxury homes, down from 10.0 in 2019
- Luxury sales rose 4.9% over the past year
- 13.9% of households earn $200,000 or more
Columbus takes the final spot, with Kansas City close behind. Listings grew faster than the number of buyers over the past year, making it the least competitive market in the top 10. Even so, affluent buyers have far fewer luxury options than in most of the largest housing markets.
*Median luxury sale prices cover June through August 2026. All other figures cover the 12 months through August 2026 and are compared with the same 12 months in earlier years.
What’s behind the hottest luxury markets
There are more high earners, but fewer luxury buyers
The number of households earning at least $200,000 a year, measured in 2024 dollars, has risen from about 15.7 million in 2019 to an estimated 19.4 million, a 23% increase. Their share of all U.S. households has grown from 12.9% to about 14%. Luxury shoppers have moved in the other direction. We estimate that roughly 61,000 households were shopping for a luxury home at any given moment over the past year. That is 11% fewer than in 2019, despite a 2.7% increase over the past 12 months.
More high earners mean a larger pool of households that could afford a luxury home. But income alone tells us little about how many want to move. The pandemic pulled many purchases forward: luxury buyers peaked in 2021 and have stayed close to 60,000 since mid-2023.

Luxury owners are listing their homes less often
The bigger story is supply. Across the largest metros, about 7.3 luxury homes came on the market for every 100 luxury homes over the past year, down from 10.9 in 2019 and 7.6 a year ago. The number of luxury homes has grown about 13% since 2019, but new listings have fallen 24%. Over the same period, the estimated number of shoppers in these metros fell about 18%. New listings fell faster, helping explain why many markets remain competitive despite weaker buying activity.
Luxury owners list least often in the hottest markets. San Jose had fewer than 4 new listings per 100 luxury homes over the past year, and San Francisco had about 4. Chicago, Baltimore, St. Louis and Milwaukee were all near 5.5. In looser markets with more luxury supply, including Miami, Tampa, Nashville and Atlanta, the rate was 10 or more.
Why owners are staying put is harder to pin down. Low mortgage rates locked in years ago are part of the explanation. But many luxury owners carry little or no mortgage, and the tax bill from selling a home that has risen sharply in value may also keep some from moving.

Luxury listings held up better where high-income household counts grew faster
Before the pandemic, luxury markets with the most top earners tended to be the most competitive. That relationship has weakened. Some of today’s tightest markets, including Cleveland and Indianapolis, have among the smallest shares of high-earning households in the country.
Supply is what changed. Luxury listings have fallen in almost every market since 2019, but the declines were smaller where the number of high-earning households grew fastest. In Austin, that number rose an estimated 59%, while luxury listings increased 20%. The market is forecast to rank 36th for competition. In Chicago, high-earning households grew about 14%, but listings fell 57%. Chicago ranks seventh. Across the largest metros, the rank correlation is +0.63. There are exceptions: Orlando and Jacksonville also added high earners rapidly, yet their luxury listings fell by more than a third.

Luxury sales are higher where there are more luxury shoppers
Nationally, about 191,600 luxury homes sold over the past year, up 1.9% from a year earlier but 12% below 2019. Across markets, sales have moved closely with the number of shoppers, both since 2019 and over the past year. San Francisco’s luxury sales rose 19% as shoppers increased about 10%, while San Jose’s sales fell 8%. Chicago stands out: luxury shoppers rose 10.5%, but listings fell 11% and sales grew just 0.5%.
Our separate forecast of luxury sales growth produces a different ranking. Seattle, Orlando, San Jose, Las Vegas and Riverside lead that list, largely because sales are well below their own five-year averages. Historically, sales in that position have tended to recover. Sales growth and buyer competition measure different things: transactions can increase in both tight markets and markets where buyers have plenty of homes to choose from.

Hot luxury markets mean more competition for buyers
Buyers should be ready to move
Luxury buyers in these markets should expect fewer choices and less time to decide. With so few sellers, the right home may not return to the market for years. Know your budget, have proof of funds ready before touring, and decide which features are essential. An agent with local luxury expertise can also help you find homes before they are widely marketed.
Sellers should still price carefully
Sellers in the hottest markets face little competition from other listings. But there are fewer luxury buyers than a few years ago, and many are taking their time. Homes priced to the market and presented well will still sell fastest. In looser markets such as Miami, Atlanta and Austin, sellers should expect buyers to negotiate on price, repairs and closing terms.
How we built the ranking
We analyzed the largest U.S. housing markets using Redfin data through August 2026, matched to the Census Bureau’s 2023 metro area definitions. Luxury homes are the most expensive 5% of sales in each Redfin region. For metros made up of several Redfin regions, the reported price is a sales-weighted average of regional medians, rather than a single pooled median. Where Redfin covers only part of a metro, we scale up the market using its share of the metro’s tax filers.
We estimate active luxury buyers and shoppers with a search-and-matching model using homes going under contract and homes for sale, assuming buyers typically search for about 10 weeks. That assumption affects the number of buyers, but not the changes over time. The competition measure averages activity over 12 months.
The forecast uses two inputs: a market’s current competition relative to other markets, and the change in that balance over the past year. We re-estimated it each month using only data available at the time. Across seven August forecasts from 2019 through 2025 with known outcomes, the model correctly identified an average of 8.29 of the 10 markets that were most competitive a year later. Simply keeping the current top 10 would have identified 8.14. That modest improvement shows how much of the forecast’s strength comes from competitive markets tending to stay competitive. The heat score puts the ranking on a 0 to 100 scale.
We count high-earning households using the Census Bureau’s American Community Survey through 2024, with a fixed income threshold of $200,000 in 2024 dollars. For 2025 and 2026, we estimate counts using real wage growth from the Bureau of Labor Statistics Employment Cost Index and total households from Census population estimates. New luxury listings per 100 luxury homes divides Redfin’s new luxury listings by the number of owner-occupied homes in the top 5% by value, measured in Census microdata. The two sources define luxury differently, so the levels are approximate and changes over time are more reliable.
All comparisons use the 12 months ending in August of each year. Luxury prices cover June through August 2026. The ranking refers to August 2027. The chart of national households and buyers uses the United States series; the new-listing-rate chart combines the metros studied.
Sources: Redfin Data Center; U.S. Census Bureau (American Community Survey, population estimates and metro area definitions); U.S. Bureau of Labor Statistics; IPUMS USA; Internal Revenue Service.