September Jobs Preview: Stable Employment, Pressure on Paychecks

Key Takeaways
- Forecasters expect slower job growth. Published consensus estimates have been around 84,000–98,000 jobs, below August’s 162,000, with unemployment expected to hold at 4.1%.
- Revelio and LinkedIn point to a softer report. Revelio estimates 56,900 jobs and LinkedIn about 40,000. Both are below consensus, but they have historically missed in the same direction.
- The key question is whether finding work gets easier. Low layoffs protect people with jobs. A broader recovery would also help unemployed workers get back in.
- Watch the breadth of improvement. Permanent job losses, involuntary part-time work, and hiring across industries will help distinguish stabilization from recovery.
- I expect continued pressure on real labor income. Employment can remain stable while nominal wage growth slows and higher price growth squeezes workers’ purchasing power.
Expect a smaller number than August
Published consensus estimates point to roughly 84,000–98,000 additional jobs in September, with the unemployment rate holding at 4.1%. That would be a step down from August.
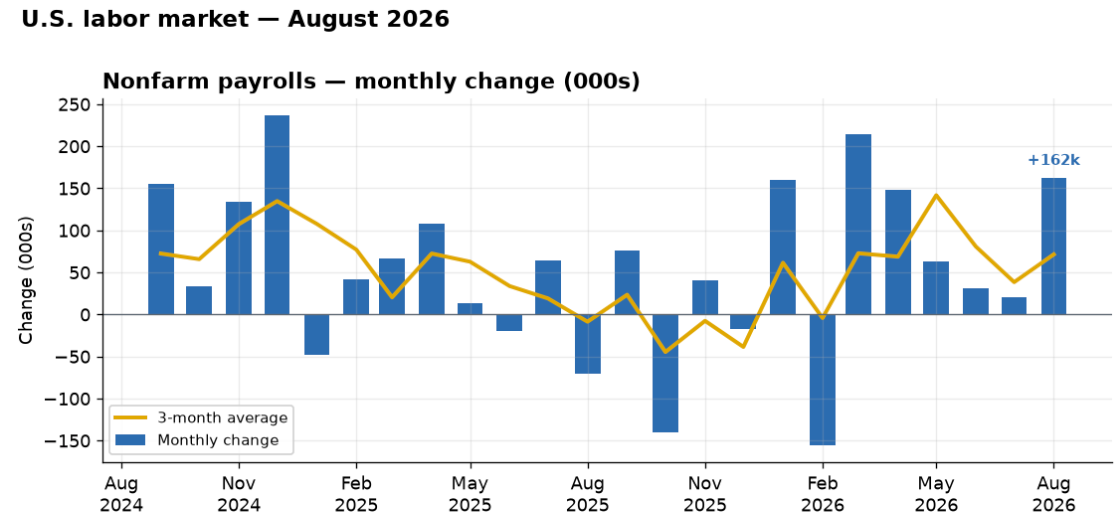
August’s gain deserves some caution. Restaurants added 59,000 jobs and local government education added 42,000. Together, they accounted for about 62% of the increase.
The school gain largely offset July’s decline. That pattern suggests school-calendar timing may have affected seasonal adjustment, although it does not establish that the entire increase was a statistical quirk.
The recent trend is more subdued: payroll growth averaged 71,000 a month over June–August. I expect September’s gain to come in below August’s. A smaller number, however, would not by itself establish renewed deterioration.
Revelio and LinkedIn point in the same direction
Two private estimates suggest September job growth could fall below consensus.
Revelio Labs estimates that employment increased by 56,900, led by public administration and health care and social assistance. Its postings data weakened: active postings fell 1.8% from August to 18.12 million, down 1.3% from a year earlier.
Hiring rates declined across 13 of 17 sector groups, while attrition rates declined across 15. That is consistent with subdued worker turnover. Attrition includes voluntary departures, however, so it is not a direct measure of layoffs.
LinkedIn’s Kory Kantenga puts September’s payroll gain near 40,000 in his Yahoo Finance interview.
Their estimates differ by 16,900 jobs. The more useful message is their shared direction: both expect a smaller gain than August and a result below published consensus estimates.
How much confidence should we put in their agreement? In the data underlying my earlier comparison, Revelio and LinkedIn each missed the BLS first payroll estimate by roughly 80,000 jobs on average over ten common months.
Both underestimated job growth in the same six months and overestimated it in the same four. They were wrong in the same direction every month. Their agreement does not eliminate the risk of a shared miss. Combined with weaker postings and hiring rates, it makes me lean toward a softer report. It does not give me confidence in a precise number.
Are unemployed workers finding jobs—or leaving the labor force?
For households, the labor market raises two different questions: How secure is my paycheck, and how hard would it be to find another one?
Low layoffs offer reassurance on the first question.
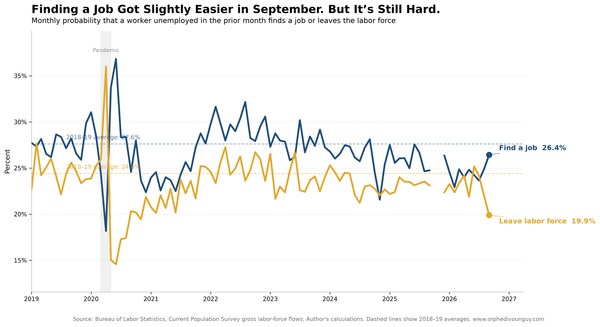
To answer the second question, I also watch what happens to people who were unemployed the previous month: how many find work, how many remain unemployed, and how many leave the labor force.
A decline in unemployment is more reassuring when it reflects people moving into jobs. Leaving the labor force does not necessarily mean giving up; it can reflect retirement, school, caregiving, or other reasons. But it is a different outcome from finding employment. For September, I want to see the probability of finding work rise.
Unemployment duration provides additional context. In August, 1.9 million people had been unemployed for at least 27 weeks. Median unemployment duration was 11.4 weeks, up from 9.9 weeks a year earlier.
Duration also needs careful interpretation. If fewer people become newly unemployed, longer spells can make up a larger share of those remaining. I will therefore read duration alongside the number of long-term unemployed and the probability of moving into work.
Is improvement reaching more workers and industries?
Low layoffs are welcome. A broader recovery would also help people secure enough hours and move into better jobs.
I will watch permanent job losers and people working part-time for economic reasons—those whose hours have been reduced or who cannot find full-time work. Sustained declines would strengthen the case that conditions are improving.
I will also watch the share of adults ages 25–54 who are employed. This focuses on prime working ages and reduces the influence of population aging relative to the overall labor-force participation rate. These measures are available in the Employment Situation tables.
The composition of payroll growth matters too. Are gains spreading across industries, or does the headline depend on a few sectors? I will look beyond health care and education to manufacturing, construction, professional and business services, and temporary-help employment.
A smaller payroll gain than August could still contain encouraging news if job-finding improves and growth broadens. A stronger headline would be less reassuring if unemployed workers continue struggling to get back in.
Why I expect continued pressure on real labor income
My expectation is that the supply shock will continue putting downward pressure on workers’ earnings and purchasing power.
The models informing my outlook help explain why. A supply shock (the oil shock we’re experiencing) raises prices and reduces the purchasing power of labor income, even though output falls only slightly.
Businesses differ in their exposure to higher input costs and their ability to pass those costs on to customers. Higher borrowing costs can add pressure by making new investments and expansion more expensive.
Paychecks remain under pressure
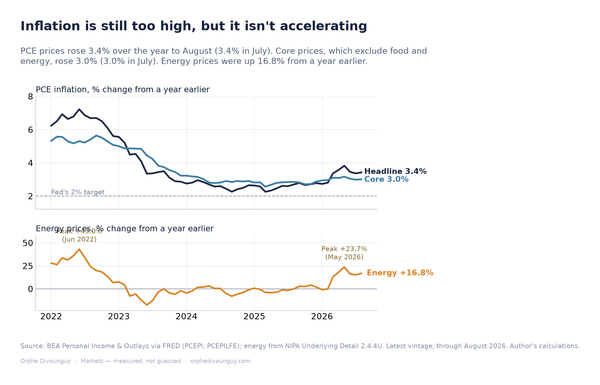
Average hourly earnings rose 3.1% over the year, below the 3.4% increase in overall consumer prices. Earnings did outpace the 2.4% rise in prices excluding food and energy. Higher energy costs are a major reason the overall comparison looks worse.
BLS estimates that real average hourly earnings fell 0.3% over the year. Real average weekly earnings rose 0.3%, reflecting a longer average workweek. Weekly purchasing power improved slightly, but purchasing power per hour declined. It is likely that individual workers chose to work more to cover their bills.
For September, I expect continued modest employment growth alongside pressure on real labor income. The breadth of job growth matters as much as the total. I’ll watch the payroll diffusion index, which measures how widely employment gains are spread across industries. A stronger headline supported by gains across many industries would be more convincing evidence of recovery than one carried by a few large sectors.
What I’ll be watching Friday, October 2: permanent job losses, involuntary part-time work, prime-age employment, long-term unemployment, hourly earnings, hours worked, the breadth of payroll growth, and revisions. In the accompanying labor-force flow data, I will watch whether unemployed workers are becoming more likely to find jobs.
More on last month’s numbers: August 2026 jobs report: the bottom, not the bounce.