The Pullback Deepens: Single-Family Permits Hit Their Lowest Since Early 2023

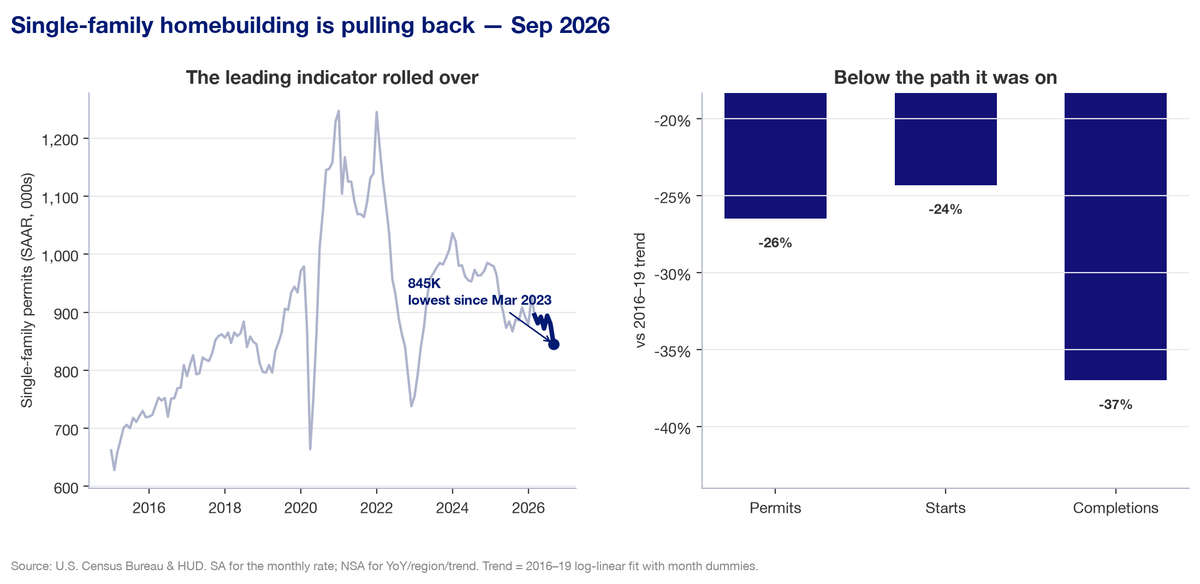
Builders are pulling back at the front of the housing pipeline. September brought another decline in single-family permits, pushing the earliest signal of future construction to its lowest level since March 2023.
Key Takeaways
- Single-family permits hit a multi-year low. They fell 4.0% in September to an 845,000 annual rate, the lowest since March 2023.
- The pullback is mostly single-family. Through September, single-family permits and starts were down from 2025, while multifamily permits rose 3.7% and starts rose 5.5%.
- The future supply pipeline is thinning. About 150,000 approved single-family homes were waiting to start, roughly two months of recent permits versus about one and a quarter months in 2019.
The headline numbers
- Building permits slipped to a seasonally adjusted annual rate of 1,400,000, down 0.2% from August and 3.0% from September 2025. Single-family permits fell to 845,000, down 4.0% for the month and 4.8% from a year earlier—their lowest rate since March 2023. Permits for units in buildings with five or more units reached 503,000.
- Housing starts fell to 1,221,000, down 5.2% from August and 7.4% from September 2025. Single-family starts declined 4.6% for the month to 859,000, although they remained 2.6% above a year earlier. Starts in buildings with five or more units were 349,000, down 25.9% year over year.
- Housing completions rose to 1,192,000, up 2.2% from August but 14.0% below September 2025. Single-family completions were 840,000, down 11.0% year over year. Completions in buildings with five or more units were 339,000, down 20.4% from a year earlier.
All headline levels are seasonally adjusted annual rates. Percentage changes compare those seasonally adjusted rates with August 2026 or September 2025.
What happened
September’s monthly numbers were mixed: total completions rose, but single-family starts and permits both fell. The clearest warning came at the front of the pipeline. Single-family permits fell to their lowest rate in three and a half years, signaling a thinner flow of homes into future construction.
This weakness did not begin in September. Single-family permits fell from a 929,000 annual rate in February to 845,000 in September. The latest decline deepened an existing retreat.
Higher mortgage rates remain a headwind. Freddie Mac’s average 30-year rate rose from 5.98% on February 26 to 7.03% on September 24, above the 6.30% recorded in the corresponding week a year earlier. That increase squeezes buyers’ purchasing power and makes builders more cautious about adding supply.
Looking at the number of homes permitted and built over the first nine months gives a broader picture. Compared with January–September 2025, single-family permits fell 2.8%, starts fell 4.0%, and completions fell 10.8%. These year-to-date comparisons use unadjusted counts rather than annualized monthly rates.
Builders also had about 150,000 approved-but-unstarted single-family homes at the end of September. That backlog equals roughly two months of recent permit issuance, compared with about one and a quarter months on average in 2019. Builders are carrying a larger backlog relative to the pace at which new permits are entering the pipeline.
The big picture

The year-to-date pullback in permits and starts remains concentrated in single-family construction. While single-family activity declined, multifamily permits rose 3.7% and starts increased 5.5% compared with January–September 2025.
Completions fell for both. But at the earlier stages—the ones that give us a better read on future construction—the two sectors are moving in different directions.

Multifamily permitting is holding up better. Permits for units in buildings with two or more units rose 6.1% from August to a 555,000 annual rate in September. The series remains volatile and well below its February 2023 peak, but it has stayed above its 2024 lows.
The comparison with the pre-pandemic path is also mixed. Through September, multifamily permits were about 23% below an extension of their 2016–19 trend, while multifamily starts were about 7% above it. That trend is an illustrative benchmark, but the contrast is clear: multifamily construction is not experiencing the same broad retreat in permits and starts as single-family construction.

Geography sharpens the split. The Census South accounted for about 60% of single-family permits in January–September 2026, essentially the same share as in the first nine months of 2024.
Multifamily permitting has become less concentrated in the South. Over that same comparison, the South’s share fell from approximately 46% to 42%, while the West’s share rose from 22% to 25% and the Midwest’s increased from 15% to 17%.
The regional mix of multifamily construction is shifting. Single-family permitting remains heavily concentrated in the South.
What comes next
Single-family construction has not collapsed below every pre-pandemic benchmark. Starts in the first nine months of 2026 were about 2.5% above their average for the same period in 2018 and 2019. But they were well below the growth path implied by the years leading into the pandemic.
September added another warning: fewer single-family homes are being permitted, fewer are being started, and a larger backlog remains approved but unstarted relative to the recent permit pace.
The concern is a thinner pipeline of future single-family supply. September’s drop in permits suggests builders are becoming more cautious about replenishing it.
Data note: Year-to-date comparisons cover January–September 2026 versus January–September 2025 and use unadjusted counts. Permit growth uses Census’s published YTD totals, which incorporate revisions not distributed to individual months. Regional shares and trend comparisons use monthly historical observations. Trend comparisons extend a 2016–19 log-linear trend with monthly seasonal controls; they are illustrative benchmarks, not forecasts. Multifamily means units in buildings with two or more units unless otherwise specified.