The consumer is still spending. But the budget is getting tighter.
Today's report from the Bureau of Economic Analysis shows that household budgets are on thin ice. The basic story is simple. Consumer budgets are being squeezed from three sides at once. Prices are still rising. Interest rates are still high. And income growth, after inflation, has been slipping.

Today's report from the Bureau of Economic Analysis shows that household budgets are on thin ice.
The basic story is simple. Consumer budgets are being squeezed from three sides at once. Prices are still rising. Interest rates are still high. And income growth, after inflation, has been slipping.
The squeeze was already visible before today’s release. Real disposable income weakened in March, even as real consumer spending kept rising. April made the pattern harder to dismiss: households spent more while their inflation-adjusted income fell again. The arithmetic was simple: households spent through falling real income by either drawing down savings or taking on more credit. Today's April release tells us the pattern didn't pause. It deepened.
The income picture
Personal income was essentially flat in April — below the consensus expectation of +0.4% and a sharp deceleration from +0.5% in March. Disposable personal income — income after taxes — fell 0.1%. After adjusting for inflation, real disposable income fell 0.5%, compared with −0.2% in March.
This is another month of contracting real disposable income, with the largest drop in April. The squeeze on what households can buy with their paychecks isn't easing. It's worsening.
The spending picture
Current-dollar consumer spending rose 0.5% in April, in line with consensus and a deceleration from 1.0% in March. Real consumer spending — spending adjusted for inflation — slowed, rising just 0.1%, compared with 0.3% in March.
The gap between current-dollar and real spending is the first thing to watch. Households spent more dollars but bought barely more goods and services. That is not the same as strong consumer demand. It is the cost of maintaining a standard of living.
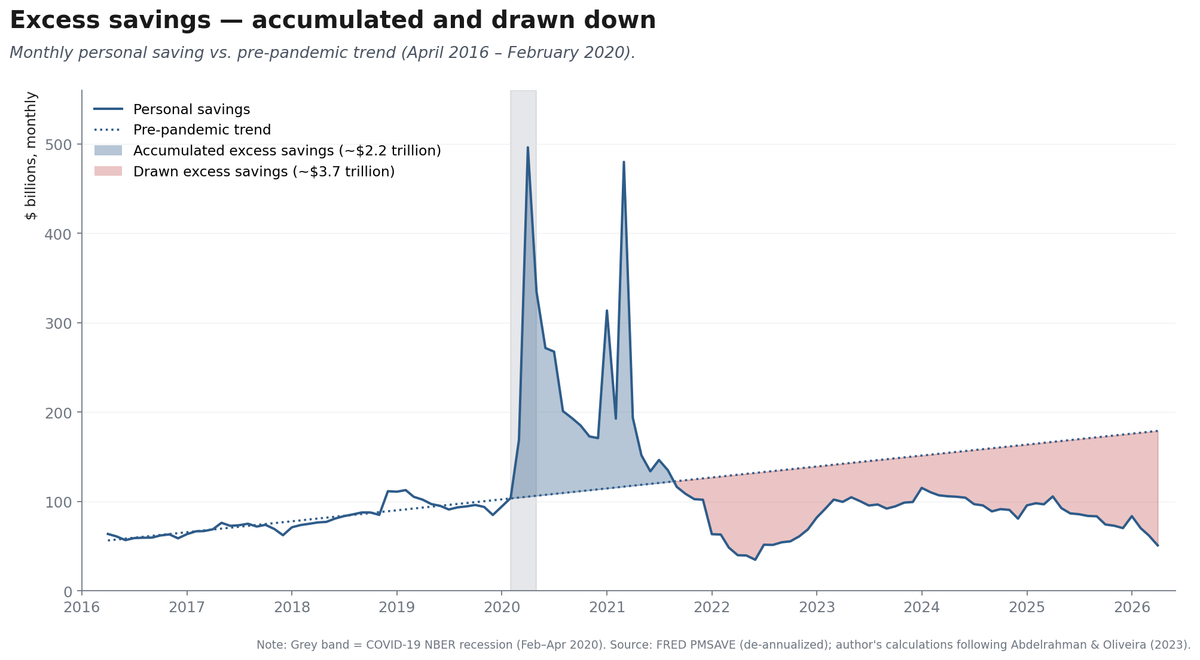
How are households doing it? By saving less. The personal saving rate fell to 2.6% in April, down from 3.2% in March, 3.6% in February, and 4.3% in January. The saving rate has fallen by 1.7 percentage points in four months. Households are not building cushions. They are digging into them.
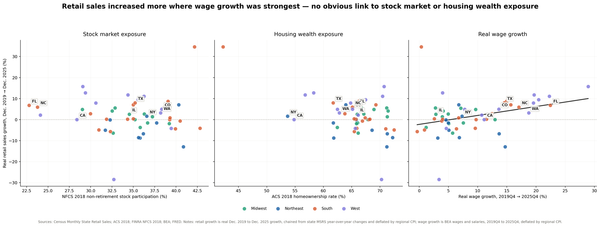
One more thing the aggregate hides. The New York Fed's Economic Heterogeneity Indicators show that since 2023, high-income households have grown real consumption faster than middle- and low-income households. And research by the San Francisco Fed and the Boston Fed shows that household saving had already fallen below the pre-pandemic trend, with lower-income households drawing down their accumulated buffers faster than they're rebuilding them. The "consumer" in aggregate spending data is increasingly two consumers — one whose spending is being driven by wealth gains and stronger real wages, and another whose spending is being maintained only by drawing down savings. April’s saving-rate drop fits that second-consumer story, even if the aggregate data cannot tell us exactly which households drew down savings.
The price picture
The PCE price index rose 0.4% in April, cooler than the 0.7% pace in March. Year-over-year, the price index was up 3.8%. The core PCE price index, which excludes food and energy, rose 0.2% on the month — below the consensus of +0.3% — and was up 3.3% from a year earlier.
The cooling in headline inflation is welcome on its face, but the composition matters. The biggest April price gain by far was gasoline and other energy goods, which rose 5.5% in a single month. Housing and utilities were up 0.5%, food at home up 0.5%, and food services up 0.5%. Categories that are hard to avoid — fuel, rent, groceries, food away from home and other recurring household costs — all rose meaningfully.
Where the spending is concentrated
Real spending grew the most in recreation services (+1.1%) and other nondurable goods (+0.6%). Real spending fell the most in motor vehicles and parts (−1.1%), clothing and footwear (−0.9%), recreational goods (−0.5%), and durable goods overall (−0.6%).
That's the pattern. Households cut durables — the big-ticket, postponable purchases — while continuing to pay for the services and small necessities that fill out the month. The strongest real-spending category was recreation services. The weakest were the most discretionary goods. Households are not booming. They are reallocating.
What this means
A healthy consumer story shows three things at once: real spending growth, real income growth, and a stable saving rate. A weaker story looks different — current-dollar spending still rising, real spending slowing, real income under pressure, the saving rate falling, and credit doing more of the work.
Today's report leans toward squeeze. Real spending barely positive. Real disposable income down for a third straight month, by the largest margin in the run. The consumer is standing — but on increasingly thin support.
One thing worth flagging. A falling saving rate doesn't always mean households are panicking. It can also mean they're betting the squeeze is temporary and drawing down savings to ride it out. Which one is happening now — and what tips us into the other — is what I'll dig into next.
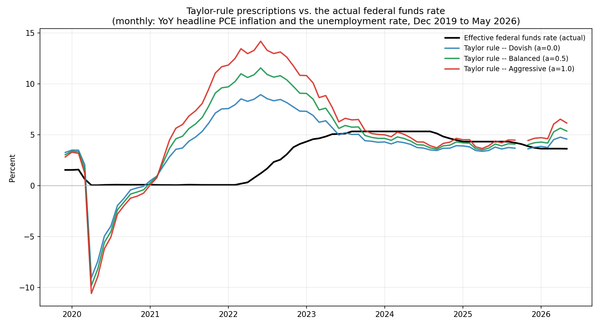
For the Federal Reserve, the dilemma sharpens. Headline and core inflation cooled in April. That gives the Fed some breathing room on the price side. But real disposable income is contracting and the saving rate is collapsing — the labor and household-finance side of the picture is the weaker leg of the stool. The Fed can ease into that weakness with rate cuts at the short end, but the long end of the curve, where mortgage and corporate borrowing rates live, is partly out of their reach.
That is the economy's uncomfortable position right now. Prices are still rising. Rates are still high. Real income is not providing the cushion it used to. And consumers are drawing down their savings to keep up.
Consumers are still spending.
But they are having to work harder to do it.
Subscribe if you'd like the next one. I write about housing, rates, labor markets, and the macro economy here each week.
Sources: U.S. Bureau of Economic Analysis, Personal Income and Outlays, April 2026; Federal Reserve Bank of New York, Economic Heterogeneity Indicators. All percent changes are month-over-month at a monthly rate unless otherwise stated; year-over-year figures compare to April 2025.