May 2026: Retail Sales Topped Expectations. Where Is the Strength Coming From?

Key Takeaways
- Retail sales have come in stronger than expected. The next state-level data, due June 25, will help locate where that strength actually sits.
- If the pandemic era is any guide, the strength is probably not concentrated in states where households had the most exposure to rising asset prices.
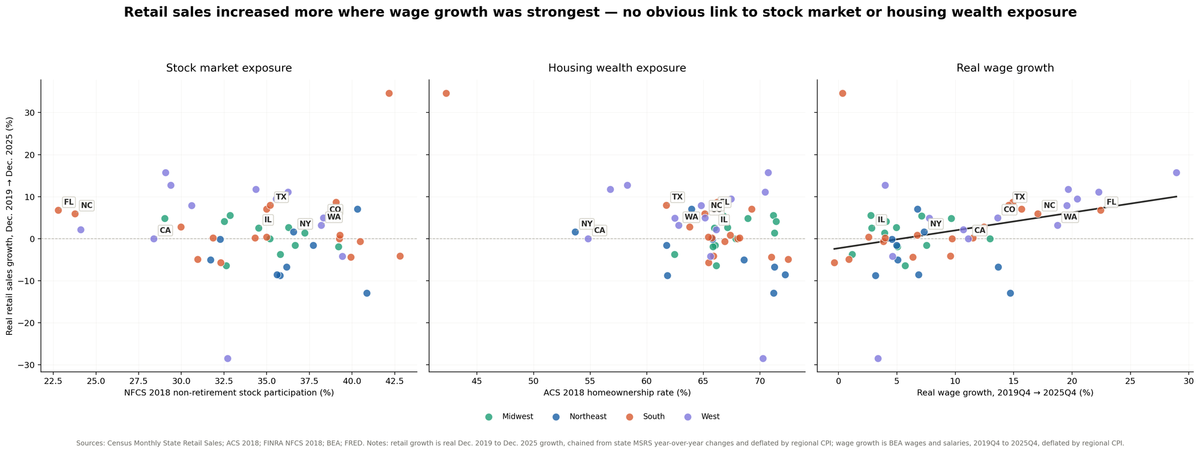
- Across states, real retail sales growth from December 2019 to December 2025 was no stronger in places with higher pre-pandemic stock-market participation — a proxy for exposure to the pandemic-era stock-market boom. It was also no stronger in places with higher pre-pandemic homeownership rates — a proxy for exposure to the home-equity boom that followed.
- The clearest positive relationship was with real labor income growth. But that is not a story about paychecks causing spending or about spending pushing up wages. Labor income and retail spending move together because local economic conditions — likely local industries, policies, and the regulatory environment — tend to affect both.
Along with the national jobs numbers, retail sales keep beating expectations.
The question that matters for retailers and investors is: where are sales likely to stay resilient?
The next release of state-level retail data, due June 25, will add another data point. Before it lands, it's worth asking what the pandemic era already taught us about where retail sales held up, and where they didn't.
First, a definition, because it shapes everything that follows. Retail sales are not the same as consumer spending. The national retail release includes retail and food services. The state-level measure used here is narrower: total retail sales excluding nonstore retailers and food services. Retail sales leave out most of the services that dominate household budgets: housing, healthcare, education, travel, and the rest. Personal consumption expenditures (PCE), the broad measure of consumer spending, is roughly two-thirds services. The two can diverge sharply. Real PCE has stayed firmly positive through this period; real retail sales have been far more uneven, because goods demand is more cyclical and more sensitive to prices than services demand. This article is about retail sales — the goods-heavy, more volatile slice — not about consumer spending as a whole.
A popular read on retail's resilience leans on wealth. Stock prices roughly tripled from their pre-pandemic level through 2025. Home prices climbed more than 50% nationally. Households that owned stocks and homes saw their balance sheets swell, and the thought is that those households kept buying. If that were the dominant force, retail sales should have been strongest where households were most exposed to those asset gains. That is a testable proposition, and the geography of retail sales can speak to it.
The test
If rising asset prices were the engine, the strength should show up where the exposure is. Stock ownership and homeownership are not spread evenly across the country. Some states have far more households positioned to benefit from rising markets and rising home equity than others. If the wealth channel is doing the work, those states should have seen stronger retail sales over the pandemic era.
These are exposure proxies, and honest ones. A state's stock-market participation rate and homeownership rate don't measure the dollars households gained — they measure how exposed a state's households were to the gains that came. Measuring that exposure before the pandemic is what makes the test clean. Measuring exposure before the pandemic avoids reverse causality from pandemic-era retail sales to ownership rates. It does not eliminate confounding.
So the setup is straightforward. For each state, take real retail sales growth from December 2019 — the last clean pre-pandemic reading — through December 2025. Line it up against two measures of pre-pandemic wealth exposure:
- Stock exposure: the share of adults with non-retirement investment accounts, from the FINRA Foundation's 2018 National Financial Capability Study.
- Housing exposure: the homeownership rate, from the Census Bureau's 2018 American Community Survey.
Everything is in real terms. Retail sales growth is built by chaining the Census Bureau's monthly state retail sales changes into a six-year cumulative figure and deflating by regional consumer price inflation. Income and wage measures are deflated the same way. That deflation matters: on nominal numbers, high-cost states look stronger simply because their prices rose faster. Adjusting for inflation strips that illusion out.
Stock exposure: no link
Plot each state's pre-pandemic stock-market participation against its six-year real retail growth, and there is no pattern to find. The cloud is flat. States where a large share of households owned stocks heading into the pandemic — and were therefore positioned to benefit from the market's surge — did not see faster real retail growth than states with low participation.
The flatness survives every control. Account for pre-pandemic income levels, add real labor income growth, add region fixed effects to absorb broad regional differences — the participation coefficient stays statistically indistinguishable from zero throughout. Whatever drove the cross-state pattern in retail sales, exposure to the stock-market boom is not visible in it.
Housing exposure: no help for the home-equity story either
The natural objection is that stock wealth is concentrated at the top, so a participation rate might be too blunt to capture the effect. Housing answers that objection. Home equity is the main asset of the middle class — held far more broadly than stock wealth. If any wealth channel were going to show up across states, housing is the most likely candidate.
It doesn't show up. States with higher pre-pandemic homeownership did not see stronger retail sales growth either.
Wages: the clearest relationship — and what it does and doesn't mean
The one measure that does line up with retail sales growth is real wage growth. States where inflation-adjusted wages and salaries grew faster over the pandemic era also saw stronger retail sales volumes. The relationship is positive, statistically robust, and holds through the same battery of controls that flatten the wealth-exposure measures.
Here is where care matters, because the obvious interpretation may be the wrong one.
It is tempting to say paychecks drive retail sales. But the causality does not run cleanly in one direction. Stronger retail sales can just as easily raise labor income — more sales mean more labor demand and more hiring, which lifts the wages-and-salaries figure directly. So a positive correlation between wage and salary income growth and retail growth is exactly what you'd expect whether income is lifting sales or sales are lifting income.
The more likely story is that neither is driving the other. Both are being lifted by the same underlying force: local economic conditions. States with strong labor demand, in-migration, population growth, booming local industries, or a friendlier regulatory environment generate rising labor income and rising retail sales together. The two move in tandem because they are both downstream of a healthy local economy — not because one causes the other.
That distinction is the whole point. Exposure to the asset booms doesn't even clear the first hurdle: it is not associated with stronger retail sales at all. The labor income relationship clears that hurdle — but the right way to read it is not "income powers sales," it's "thriving local economies show up in both their paychecks and their cash registers."
What this does and does not mean
This is a cross-sectional comparison across 51 states, not a controlled experiment, and it deserves matching humility.
It cannot see what state averages wash out. If the households buying most out of their stock and housing gains are a thin slice at the top of the wealth distribution, a state average — which pools them with everyone else — will not detect them. So this analysis is not a verdict on whether asset gains lift the spending of the households that hold them. It is a statement about geography: across states, retail-sales strength does not line up with where that exposure is concentrated.
What this analysis establishes is narrower and forward-useful. Across states, retail sales were not strongest where exposure to the pandemic's asset booms was greatest. They held up where local economies were strong enough to lift labor income and sales together. That is the better place to look for where retail sales stay resilient next: the strength of local economies, not the map of who owned stocks or homes.
Bottom line
If the pandemic era is any guide, retail sales resilience will not be concentrated in the states most exposed to stock-market or housing gains. Retail sales are likely to look more resilient where local economic conditions — local industries, in-migration, the regulatory environment — have supported both labor income and sales. Local pandemic-era restrictions could also have played a role. Where retail stays resilient is a story about local economies, not about portfolios and home equity.
| Rank | State | Retail Growth (inflation-adjusted) | Real Wage Growth | Stock Market Participation Rate | Homeownership Rate |
|---|---|---|---|---|---|
| 1 | District of Columbia | +34.6% | +0.4% | 42.2% | 42.3% |
| 2 | Idaho | +15.7% | +28.9% | 29.1% | 70.7% |
| 3 | Hawaii | +12.7% | +4.0% | 29.4% | 58.3% |
| 4 | Nevada | +11.8% | +19.7% | 34.4% | 56.8% |
| 5 | Utah | +11.1% | +22.3% | 36.2% | 70.5% |
| 6 | Montana | +9.5% | +20.4% | 35.6% | 67.5% |
| 7 | Tennessee | +8.7% | +14.9% | 39.1% | 66.2% |
| 8 | Texas | +7.9% | +14.6% | 35.2% | 61.7% |
| 9 | Arizona | +7.9% | +19.6% | 30.6% | 64.8% |
| 10 | New Jersey | +7.1% | +6.8% | 40.3% | 64.0% |
| 11 | South Carolina | +7.1% | +15.7% | 35.0% | 69.3% |
| 12 | Florida | +6.8% | +22.4% | 22.8% | 65.9% |
| 13 | North Carolina | +5.9% | +17.1% | 23.8% | 65.1% |
| 14 | Michigan | +5.6% | +2.8% | 32.9% | 71.2% |
| 15 | Missouri | +5.4% | +7.1% | 39.1% | 66.8% |
| 16 | Colorado | +5.0% | +13.6% | 38.3% | 65.1% |
| 17 | Oregon | +4.9% | +7.8% | 35.0% | 62.5% |
| 18 | Indiana | +4.8% | +9.7% | 29.0% | 68.9% |
| 19 | Minnesota | +4.1% | +4.1% | 32.5% | 71.5% |
| 20 | Washington | +3.2% | +18.7% | 38.2% | 62.8% |
| 21 | Georgia | +2.8% | +12.4% | 30.0% | 63.8% |
| 22 | Wisconsin | +2.6% | +5.0% | 36.3% | 67.1% |
| 23 | Illinois | +2.5% | +2.8% | 34.5% | 66.0% |
| 24 | New Mexico | +2.1% | +10.7% | 24.1% | 66.2% |
| 25 | New York | +1.6% | +7.3% | 36.6% | 53.7% |
| 26 | Iowa | +1.4% | +4.0% | 37.2% | 71.3% |
| 27 | Kentucky | +0.9% | +6.8% | 39.3% | 67.4% |
| 28 | Oklahoma | +0.4% | +2.6% | 35.0% | 65.4% |
| 29 | Mississippi | +0.2% | +4.0% | 31.9% | 68.2% |
| 30 | Arkansas | +0.2% | +11.5% | 34.3% | 65.8% |
| 31 | California | +0.0% | +11.1% | 28.4% | 54.8% |
| 32 | South Dakota | −0.0% | +13.0% | 35.2% | 67.9% |
| 33 | Alabama | −0.0% | +9.7% | 39.3% | 68.0% |
| 34 | Connecticut | −0.1% | +4.6% | 32.3% | 65.8% |
| 35 | Maryland | −0.7% | +3.9% | 40.5% | 66.9% |
| 36 | Massachusetts | −1.6% | +5.0% | 37.7% | 61.8% |
| 37 | Nebraska | −1.6% | +7.5% | 36.7% | 66.1% |
| 38 | Ohio | −1.9% | +5.0% | 39.2% | 65.9% |
| 39 | North Dakota | −3.7% | +1.2% | 35.8% | 62.5% |
| 40 | Virginia | −4.2% | +9.6% | 42.8% | 65.9% |
| 41 | Alaska | −4.2% | +4.6% | 39.4% | 65.6% |
| 42 | Delaware | −4.4% | +6.4% | 39.9% | 71.0% |
| 43 | West Virginia | −4.9% | +0.9% | 31.0% | 72.5% |
| 44 | Pennsylvania | −5.1% | +5.1% | 31.7% | 68.6% |
| 45 | Louisiana | −5.7% | −0.4% | 32.3% | 65.5% |
| 46 | Kansas | −6.4% | +5.7% | 32.6% | 66.2% |
| 47 | New Hampshire | −6.8% | +13.7% | 36.2% | 71.3% |
| 48 | Vermont | −8.6% | +6.9% | 35.6% | 72.2% |
| 49 | Rhode Island | −8.8% | +3.2% | 35.8% | 61.8% |
| 50 | Maine | −12.9% | +14.7% | 40.9% | 71.2% |
| 51 | Wyoming | −28.5% | +3.4% | 32.7% | 70.3% |
Note: Scroll horizontally to view the full table on smaller screens.
Note: DC is a clear outlier and should be interpreted cautiously. Visitor spending, commuting patterns, federal-government dynamics can make DC behave differently from states.
Methodology
Outcome. Real retail sales growth by state, December 2019 to December 2025. A state-level retail index is constructed by chaining the Census Bureau's Monthly State Retail Sales (MSRS) year-over-year changes for Total Retail Sales excluding nonstore retailers, then deflated by regional CPI-U (all items), mapped to states by Census region. The result is a cumulative six-year real growth figure per state (national real mean ≈ 1.7%; many states negative).
Wealth-exposure measures. Stock-market participation is the share of adults reporting non-retirement investment accounts in the 2018 FINRA Foundation National Financial Capability Study (State-by-State Survey, roughly 500 respondents per state, weighted to each state's demographic margins). The NFCS is a quota-sampled online panel weighted to age, gender, ethnicity, and education within each state; it is not a probability sample, and state estimates carry roughly ±4 points of sampling error. Homeownership is the owner-occupied share of occupied housing units from the Census 2018 ACS 1-year estimates (table B25003). Both are measured pre-pandemic, before the outcome window.
Controls. Real wage and salary income growth is BEA state quarterly wages and salaries (table SQINC4), 2019Q4 to 2025Q4, deflated by regional CPI. Real income level is 2018 ACS median household income (B19013) divided by the state's Regional Price Parity (BEA table SARPP), then logged. Robustness specifications add lagged retail growth (a mean-reversion check) and Census-region fixed effects.
Estimation. Ordinary least squares, 51 observations, HC3 robust standard errors. Across specifications, pre-pandemic stock participation is statistically indistinguishable from zero (p ≈ 0.67–0.85). Pre-pandemic homeownership is consistently negative and ranges from marginally significant to significant once region fixed effects are included (β ≈ −0.81 to −0.91). Real wage and salary income growth is positive and significant throughout (β ≈ 0.44–0.62).
Interpretation and limits. Single cross-section; suggestive, not causal. The wage–retail association should not be read as income causing sales: retail strength can raise wage income, and both plausibly reflect common local economic conditions. State averages cannot detect asset-gain effects concentrated in a thin slice of high-wealth households, so this is a statement about cross-state geography, not about household-level behavior. MSRS is an experimental modeled series excluding nonstore (online) retailers. Regional CPI is a four-region deflator. Exposure rates measure access to asset-price gains, not the dollar value of those gains.
Sources: U.S. Census Bureau, Monthly State Retail Sales and American Community Survey; U.S. Bureau of Economic Analysis, Regional Economic Accounts (SQINC4, SARPP); Federal Reserve Bank of St. Louis (FRED), regional CPI-U; FINRA Investor Education Foundation, 2018 National Financial Capability Study. Retail growth is real, December 2019 to December 2025, chained from state MSRS year-over-year changes and deflated by regional CPI. Cross-sectional analysis across 50 states and the District of Columbia.