Is the AI-Era Productivity Shock Hurting Employment? A structural decomposition of technology and non-technology shocks, 1948–2026

Key Takeaways
- A structural model estimated on 78 years of U.S. data separates two forces in the labor market: technology shocks, which permanently shift labor productivity, and non-technology shocks, which move employment and output together without any permanent effect on productivity.
- Non-technology shocks — a broad category that includes monetary policy, fiscal conditions, financial conditions, confidence, and labor supply — have been the dominant drag on employment and output since 2024. In 2026 Q1 they subtracted 1.35 percentage points from employment growth and 1.42 points from output growth.
- In 2026 Q1, the technology-channel contribution to employment was +0.22 percentage point. That does not mean a favorable technology shock boosted hiring. It means productivity ran below its long-run path, so employment was higher than it would have been under trend productivity.
- The technology signal in productivity is real and building, currently tracking the early years of the 1990s IT boom. The main difference between then and now is in the non-technology column.
The question
The labor-market question is not whether AI is showing up in productivity. It is whether the technology shock is large enough — and the broader economic environment strong enough — to offset weakness elsewhere in the economy.
A Galí-style structural VAR says no.
The model does not identify AI directly. It identifies technology shocks: innovations that permanently shift the level of labor productivity. In the current cycle, that is the closest structural proxy for the AI and productivity channel available from aggregate data. The result is clear. The productivity signal is real and building, but it is not the force holding employment below trend. Since 2024, the dominant drag has come from the non-technology side of the economy — monetary policy, financial conditions, fiscal conditions, confidence, and labor supply combined.
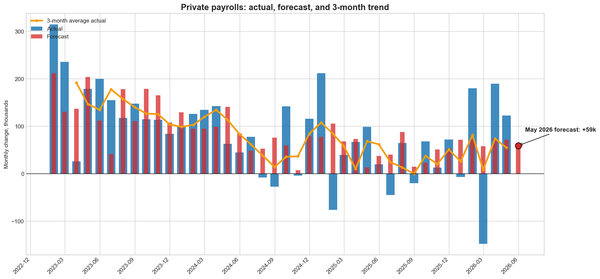
Total nonfarm payroll employment rose 172,000 in May, well above the consensus estimate of 85,000. The unemployment rate held at 4.3 percent. After 2025 averaged roughly 15,000 jobs per month — near stall speed — the May figure represents a notable firming. The structural decomposition in this note runs through 2026 Q1, the most recent quarter for which the full GDP-employment accounting is available. Those results establish the prevailing structural conditions entering the second quarter. They are the backdrop against which the May jobs report landed, not a direct attribution of May's outcome. Whether the Q1 structural pattern extended into April and May requires Q2 data not yet released.
The Q1 picture is this: technology shocks and non-technology shocks pulled in opposite directions on employment. The non-technology shock was the dominant force, subtracting 1.35 percentage points from employment growth against a long-run trend of 1.68 percent. A modest adverse technology realization — productivity running below its long-run trend — added 0.22 points back. The May print does not contradict that structural backdrop, but the model cannot attribute April or May outcomes until Q2 GDP and labor-input data are available.
What the model identifies
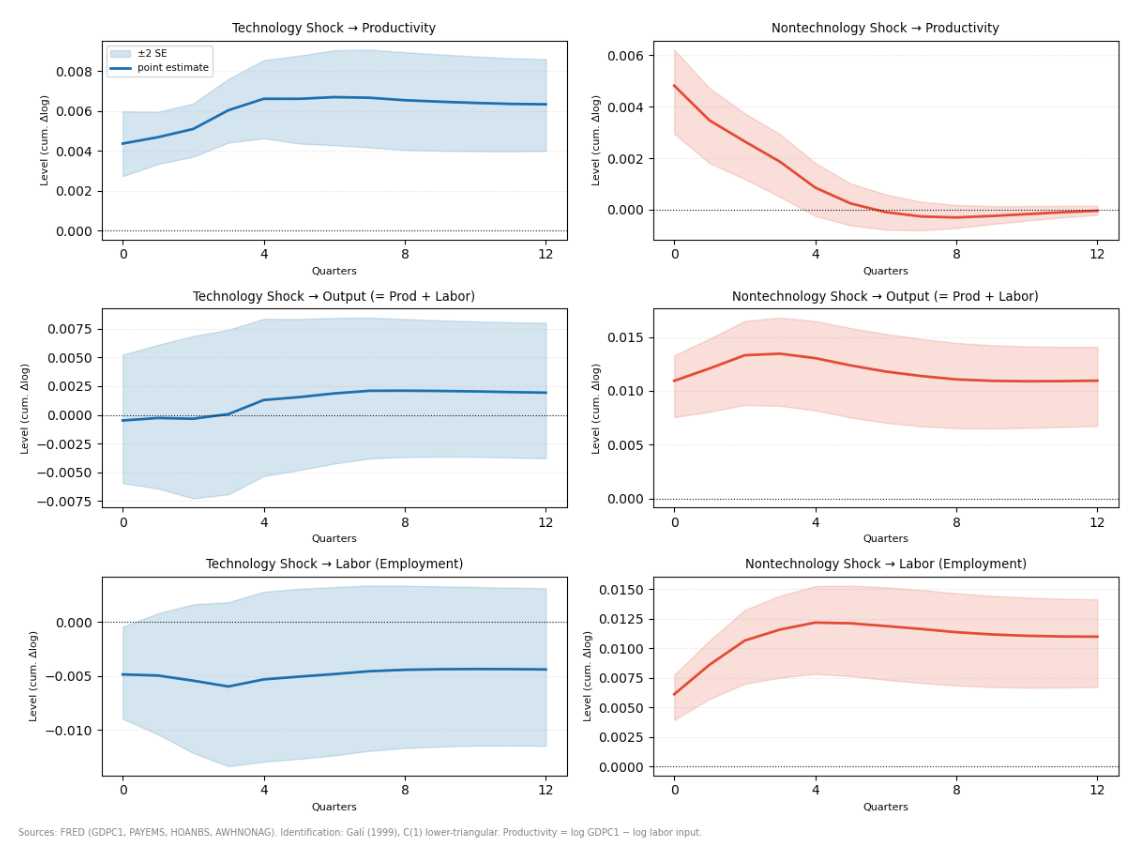
Galí (1999) estimates a bivariate structural VAR in the growth rates of labor productivity and labor input. The identifying restriction is precise: only technology shocks can permanently shift the level of labor productivity. Non-technology shocks have no permanent effect on productivity. They can move employment and output above or below trend in the short run, but that effect dissipates.
The key result is that a favorable technology shock — one that raises productivity above its long-run trend — simultaneously moves employment below trend. Productivity rises; employment falls; output barely moves, because the productivity gain and the employment decline are approximately equal and opposite in the log accounting identity. The conditional correlation between productivity growth and employment growth is strongly negative given a technology shock (−0.96 in this estimation) and strongly positive given a non-technology shock (+0.63). That sign reversal is the entire identification.
The model is estimated on quarterly U.S. data from 1948 Q2 through 2026 Q1. Labor productivity is log real GDP minus log nonfarm payroll employment — output per payroll job. The trend in each decomposition is the long-run average growth rate implied by the VAR over the full estimation window: approximately 1.7 percent per year for employment, 3.1 percent for output, and 1.4 percent for labor productivity. All deviations are measured relative to those baselines.
Because payroll employment is not the same as total labor input, the exercise is replicated using nonfarm business hours (HOANBS, Galí's original labor measure) and a constructed total-hours series following BLS methodology (average weekly hours × employment × 4.333 weeks per month). The qualitative result is unchanged across all three measures.
Employment: non-technology shocks are the dominant force
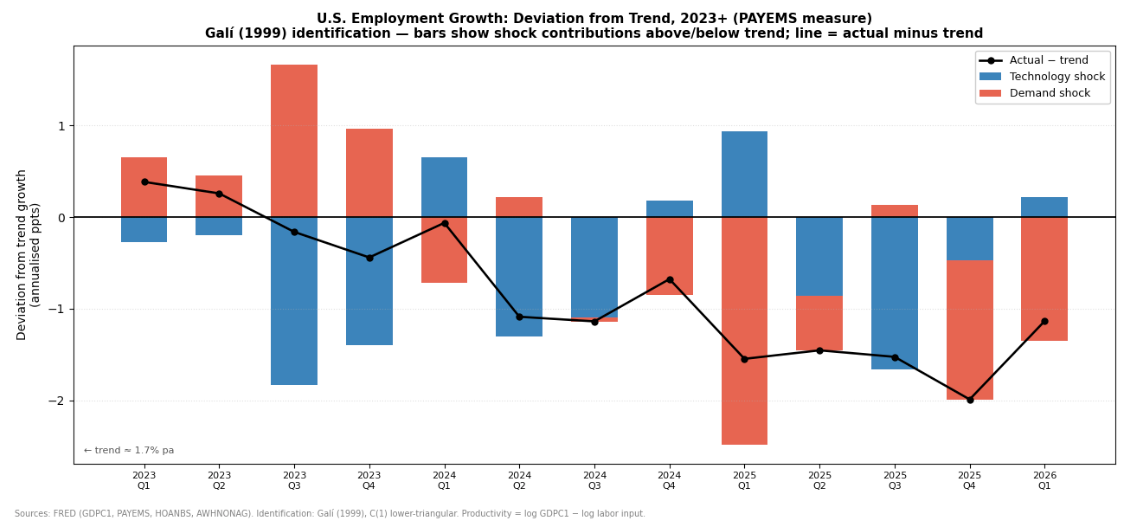
Employment growth decomposition, 2023 Q1 – 2026 Q1 (Annualised percentage points. Actual = Trend + Technology + Non-technology.)
| Quarter | Actual | Trend | Technology | Non-technology |
|---|---|---|---|---|
| 2023 Q1 | 2.047 | 1.664 | −0.271 | 0.655 |
| 2023 Q2 | 1.919 | 1.661 | −0.194 | 0.451 |
| 2023 Q3 | 1.376 | 1.538 | −1.827 | 1.665 |
| 2023 Q4 | 1.124 | 1.564 | −1.401 | 0.960 |
| 2024 Q1 | 1.550 | 1.614 | 0.650 | −0.714 |
| 2024 Q2 | 0.581 | 1.669 | −1.305 | 0.218 |
| 2024 Q3 | 0.550 | 1.688 | −1.095 | −0.043 |
| 2024 Q4 | 1.022 | 1.699 | 0.177 | −0.854 |
| 2025 Q1 | 0.154 | 1.701 | 0.934 | −2.481 |
| 2025 Q2 | 0.255 | 1.709 | −0.858 | −0.595 |
| 2025 Q3 | 0.177 | 1.702 | −1.660 | 0.135 |
| 2025 Q4 | −0.293 | 1.696 | −0.469 | −1.520 |
| 2026 Q1 | 0.550 | 1.684 | 0.219 | −1.354 |
Source: FRED (GDPC1, PAYEMS). Identification: Galí (1999).
Non-technology shocks have been a drag on employment in four of the last five quarters. The sharpest single-quarter contraction was 2025 Q1 (−2.48 points), with a brief respite in Q3 2025 before turning negative again in Q4 2025 and 2026 Q1. This is the primary force pulling employment below its long-run trend.
Technology shocks have been volatile. The large negative readings in 2023 Q3–Q4 (−1.83 and −1.40) reflect quarters in which productivity ran substantially above its long-run trend — the Galí substitution result: employment moved lower relative to output as productivity rose. The positive readings in 2024 Q1, 2025 Q1, and 2026 Q1 reflect the opposite: productivity ran below its long-run trend, and employment ran higher than a trend-productivity path would require. The 2026 Q1 reading of +0.22 is the most recent instance of that pattern. It is a partial cushion against the non-technology drag, not evidence of technology creating jobs.
Output: non-technology shocks explain most of the shortfall
Output growth decomposition, 2023 Q1 – 2026 Q1 (Annualised percentage points. Actual = Trend + Technology + Non-technology.)
| Quarter | Actual | Trend | Technology | Non-technology |
|---|---|---|---|---|
| 2023 Q1 | 2.885 | 3.068 | −1.413 | 1.230 |
| 2023 Q2 | 2.504 | 3.038 | −1.064 | 0.530 |
| 2023 Q3 | 4.588 | 2.791 | −0.862 | 2.659 |
| 2023 Q4 | 3.362 | 3.011 | −0.332 | 0.682 |
| 2024 Q1 | 0.839 | 3.081 | −0.073 | −2.169 |
| 2024 Q2 | 3.526 | 3.120 | −0.167 | 0.573 |
| 2024 Q3 | 3.286 | 3.111 | 0.377 | −0.202 |
| 2024 Q4 | 1.835 | 3.108 | 0.324 | −1.597 |
| 2025 Q1 | −0.651 | 3.114 | 0.102 | −3.866 |
| 2025 Q2 | 3.766 | 3.100 | 0.278 | 0.388 |
| 2025 Q3 | 4.282 | 3.085 | 0.187 | 1.010 |
| 2025 Q4 | 0.481 | 3.087 | −0.011 | −2.595 |
| 2026 Q1 | 1.608 | 3.076 | −0.053 | −1.415 |
Source: FRED (GDPC1, PAYEMS). Identification: Galí (1999).
The technology contribution to output is consistently smaller in absolute magnitude than the non-technology contribution, particularly from 2024 onward. This follows directly from the log accounting identity: output equals productivity plus employment. When a technology shock raises productivity and lowers employment in roughly equal measure, the two effects offset each other in output. Technology reshapes the split between productivity and labor input. Non-technology conditions determine how far output deviates from its long-run trend.
In 2026 Q1, the non-technology shock subtracted 1.42 points from output growth against a trend of 3.08 percent. The technology contribution was −0.05. Actual output grew 1.61 percent. The shortfall relative to trend is a non-technology story.
The internal consistency check: the technology contribution to output in 2026 Q1 (−0.053) equals the technology contribution to productivity (−0.273) plus the technology contribution to employment (+0.219). The productivity shortfall that partially supported employment in that quarter simultaneously subtracted from output, holding it below what a trend-productivity path would have produced.
The 1990s comparison
The natural reference is the late 1990s IT boom. The following annual averages of the structural decomposition isolate what differs across the two eras.
Annual averages of employment deviation from trend (Percentage points. Positive = above long-run trend.)
| Year | Technology | Non-technology | Actual − Trend |
|---|---|---|---|
| 1996 | −0.46 | +1.14 | +0.68 |
| 1997 | −0.13 | +1.22 | +1.09 |
| 1998 | −0.62 | +1.35 | +0.73 |
| 1999 | −0.65 | +1.45 | +0.80 |
| 2000 | −0.44 | +0.23 | −0.21 |
| 1996–2000 avg | −0.46 | +1.08 | +0.62 |
| 2023 | −0.92 | +0.93 | +0.01 |
| 2024 | −0.39 | −0.35 | −0.74 |
| 2025 | −0.51 | −1.12 | −1.63 |
| 2023–2025 avg | −0.61 | −0.18 | −0.79 |
Annual averages of output deviation from trend
| Year | Technology | Non-technology | Actual − Trend |
|---|---|---|---|
| 1996–2000 avg | +0.07 | +1.05 | +1.13 |
| 2023–2025 avg | −0.22 | −0.28 | −0.50 |
Annual averages of productivity deviation from trend
| Year | Technology | Non-technology | Actual − Trend |
|---|---|---|---|
| 1996 | +0.21 | +0.36 | +0.57 |
| 1997 | +0.24 | −0.03 | +0.21 |
| 1998 | +0.68 | +0.28 | +0.95 |
| 1999 | +0.86 | −0.02 | +0.84 |
| 2000 | +0.68 | −0.69 | −0.01 |
| 1996–2000 avg | +0.53 | −0.02 | +0.51 |
| 2023 | +0.01 | +0.34 | +0.35 |
| 2024 | +0.51 | −0.50 | +0.01 |
| 2025 | +0.65 | −0.15 | +0.50 |
| 2023–2025 avg | +0.39 | −0.10 | +0.29 |
Source: FRED (GDPC1, PAYEMS). Identification: Galí (1999). Annual averages of quarterly deviations from long-run trend.
Three structural comparisons stand out.
Technology's effect on employment is negative in both eras. Technology shocks pulled employment below trend every year of the 1990s boom — the Galí substitution result: rising productivity reduced the workers required to meet existing output demand. The same pattern holds today, and the average technology drag on employment is slightly larger in the current period (−0.61) than in the 1990s (−0.46). Technology is not more benign now than it was then.
The technology contribution to productivity is positive and growing in both eras, but today's signal is smaller. Over 1996–2000, technology shocks pushed productivity above its long-run trend by an average of +0.53 points per year, building from +0.21 in 1996 to a peak of +0.86 in 1999. Over 2023–2025, the contribution averaged +0.39 points above trend — starting near zero in 2023 and reaching +0.65 in 2025. The signal is real and building. It is tracking the early years of the IT boom, not the peak. For reference, average productivity growth — output per payroll job — was 1.65 percent per year over 1995–2000 and 1.64 percent over 2023–2026 Q1.
The non-technology column is what differs across the two eras. Over 1996–1999, the non-technology side of the economy contributed an average of +1.08 points above trend to employment and +1.05 to output each year — a persistent tailwind that absorbed the labor that rising productivity freed up and drove both above trend. Over 2023–2025, the non-technology contribution averaged −0.18 on employment and −0.28 on output. The technology engine is running on a similar trajectory to the 1990s. The non-technology conditions that turned the 1990s productivity signal into a sustained labor market expansion are not present.
Bottom line
The structural decomposition is unambiguous on the primary driver. The model says the drag on employment and output is not coming primarily from the technology channel. It is coming from the non-technology side of the economy — monetary policy, financial conditions, fiscal conditions, confidence, and labor supply combined. Technology shocks have been secondary and volatile: a mild net drag on employment consistent with above-trend productivity in most of 2023–2025, and a small cushion in the specific quarters where productivity ran below its long-run path.
Today does not look like AI is hurting employment. It looks like a productivity signal is emerging, but the broader macro environment is not absorbing labor the way it did in the late 1990s.
The 1990s comparison makes the structural picture precise. Both eras show a building technology signal in productivity, and both show a corresponding technology drag on employment — the standard Galí result. What the 1990s had and today does not is a non-technology environment large enough to absorb the labor that rising productivity freed up and drive both employment and output well above trend. The question for the current expansion is whether those non-technology conditions change, not whether the technology signal strengthens.
Methodology
Model. Bivariate structural VAR in [Δ log productivity, Δ log employment], p = 4 lags, estimated on quarterly U.S. data 1948 Q2 – 2026 Q1. Identification follows Galí (1999): the long-run structural matrix C(1)·A0 is lower-triangular, restricting the non-technology shock to have zero permanent effect on the level of labor productivity.
Data. Real GDP: GDPC1. Labor input: PAYEMS, nonfarm payroll employment. Labor productivity: log(GDPC1) − log(PAYEMS).
Trend. The long-run average growth rate implied by the VAR over the full 1948–2026 estimation window: approximately 1.7 percent per year for employment, 3.1 percent for output, and 1.4 percent for labor productivity.
On the non-technology category. The non-technology shock captures every disturbance that cannot permanently shift labor productivity. That is a broad residual. It includes aggregate demand shocks — monetary tightening, fiscal adjustment, financial conditions, confidence — but also labor supply shocks. The sustained increase in labor force participation driven by immigration over 2022–2024 would appear in this model as a positive non-technology contribution to employment and a negative contribution to productivity per worker in the short run. The strong positive non-technology contributions to employment in 2023 are consistent with a large labor supply expansion in that period. The subsequent turn to persistent negative readings in 2024–2025 is consistent with both the moderation of those flows and the lagged pass-through of monetary tightening. The bivariate model cannot separate these components; doing so would require additional identifying restrictions beyond the Galí framework.
Robustness. Results replicated using (a) nonfarm business hours index (HOANBS), Galí's original labor measure, and (b) constructed total hours (AWHNONAG × PAYEMS × 4.333 weeks per month), following BLS methodology. All three measures produce a negative conditional correlation between productivity and labor growth conditional on the technology shock (−0.93 to −0.97), and a positive one conditional on the non-technology shock (+0.53 to +0.63), consistent with Galí (1999) Table 1.
Uncertainty. Historical decomposition estimates are point estimates. Bootstrap confidence intervals for impulse responses confirm the sign and direction of both shocks across all three labor measures. Individual-quarter contributions carry non-trivial uncertainty; the analysis focuses on multi-quarter patterns. Table components may not sum exactly to totals due to rounding; underlying values satisfy the accounting identity to machine precision.
Timeline. The decomposition ends in 2026 Q1. The May 2026 employment report, released June 5, post-dates the decomposition. Q1 results are treated as the structural backdrop entering Q2, not a direct structural attribution of the May outcome.
References
Galí, J. (1999). Technology, employment, and the business cycle: Do technology shocks explain aggregate fluctuations? American Economic Review, 89(1), 249–271.
Blanchard, O., and Quah, D. (1989). The dynamic effects of aggregate demand and supply disturbances. American Economic Review, 79(4), 655–673.
Basu, S., Fernald, J., and Kimball, M. (2006). Are technology improvements contractionary? American Economic Review, 96(5), 1418–1448.
U.S. Bureau of Labor Statistics (2026). The Employment Situation — May 2026.
Data: FRED (GDPC1, PAYEMS). Structural VAR estimated on quarterly U.S. data, 1948–2026; identification per Galí (1999). Productivity defined as real output per payroll job.