Stabilizing, Not Accelerating: Where the Labor Market Could Be Headed Next
The labor market is not collapsing. It is not strengthening. The most honest description is the one the data keeps repeating: stabilizing in a low-hire, low-fire equilibrium, not accelerating. For the next several months that is the operating assumption.

The April jobs report showed a labor market that has stopped getting worse but has not started getting better. The leading indicators point to more of the same.
Bottom line
- April nonfarm payrolls rose 115,000 and unemployment held at 4.3%. Strip out federal cuts and private payrolls rose 124,000 — but the three-month private trend is just 55,000 per month.
- The weakness is showing up in hours and real wages before it shows up in the unemployment rate. Involuntary part-time work jumped 445,000 in April. Labor-force participation fell again.
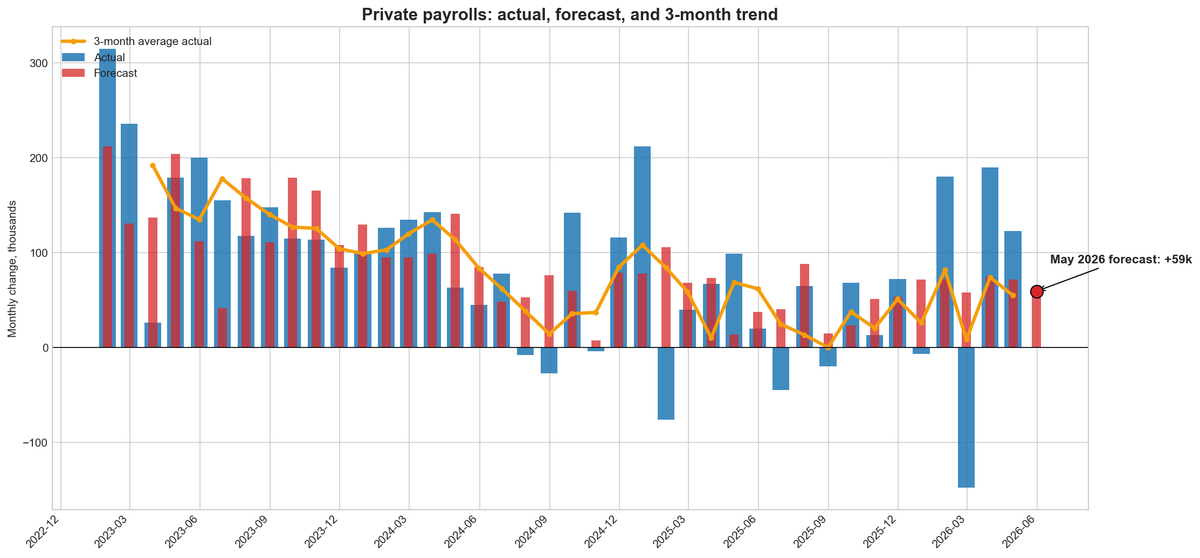
- My nowcast for May private payrolls, built on six decades of data and tested against eight model alternatives, points to around 59,000 jobs. The labor market is stabilizing, not accelerating.
The headline numbers from April were not bad. Nonfarm payrolls rose 115,000. The unemployment rate held at 4.3%. The average workweek edged up to 34.3 hours, recovering March's small decline.
The trend underneath the headline is softer. Nonfarm payroll growth has averaged just 48,000 jobs per month over the past three months. Combined revisions to February and March took 16,000 jobs off prior estimates. The labor force shrank again, with 188,000 more people leaving than entering. Labor-force participation fell to 61.8%.
One number stands out. The count of people working part-time for economic reasons — workers who want full-time work but cannot find it, or whose hours have been cut — jumped by 445,000 in April, to 4.9 million. Job quality is deteriorating even though the unemployment rate is not.
This is the pattern that distinguishes a labor market that is stabilizing from one that is strengthening. Weakness shows up in hours and real wages first. It shows up in the unemployment rate last, after employers have exhausted the cheaper margins of adjustment — slowing hiring, reducing hours, leaning on existing workers. The unemployment rate is the slowest part of the labor market to break.
Strip out federal cuts and the private-sector picture is similar
The nonfarm headline includes one large, distinct story: federal government layoffs. Federal employment fell another 9,000 in April and is now down 348,000 — 11.5% — since its October 2024 peak. That is a policy choice working its way through the labor market in real time, and it has been a meaningful drag on the headline payroll number for the better part of a year.
Once you strip federal employment out, you get a cleaner read on what is happening in the private economy. Private payrolls rose roughly 124,000 in April. The three-month average for private payrolls is 55,000 per month. Private hiring is running slightly stronger than the nonfarm headline — but only because the nonfarm number is being dragged down by federal cuts. The underlying private trend is also slow.
This is why my nowcast focuses on private payrolls rather than the total nonfarm headline. The federal-employment story is real, but it is a separate phenomenon driven by policy and largely predictable from administrative decisions, not from the same labor-market indicators that drive private-sector hiring. Forecasting them together blurs both stories. Forecasting them separately tells you something cleaner about each.
What is driving the slowdown
The composition of private hiring tells you who is and is not hiring.
Health care continues to add jobs at a steady clip — 37,000 in April. Transportation, warehousing, and retail trade added jobs. These are the cyclically defensive sectors — services households cannot easily defer, plus the goods-distribution chain that benefits from any consumer spending at all.
The cyclical sectors are flat. Construction, manufacturing, professional and business services, leisure and hospitality, financial activities — all close to zero in April. These are the sectors that hire when companies are confident about future demand. They are not hiring.
Information employment continues to slide. Information has lost 342,000 jobs since November 2022, as tech-sector retrenchment and AI-driven productivity shifts work through the data. This is structural rather than cyclical, but it shows up in the monthly headline regardless.
Where the indicators say it is headed
To assess where the private labor market is going from here, I built a one-month-ahead nowcast for private payrolls, trained on six decades of monthly data and validated against eight model alternatives in a real-time one-step backtest from January 2024 through April 2026.
The model uses six predictors, each chosen for a specific role. Two lags of monthly payroll change and a three-month moving average capture momentum — whether the labor market is accelerating or decelerating. The four-week changes in initial and continuing unemployment claims capture real-time churn on the layoff side and are the most direct high-frequency input on labor demand. A lagged change in government employment captures cross-sectoral fiscal spillovers from the federal cuts described above. Training data covers 1967 through the most recent release, with February 2020 through June 2022 excluded to avoid pandemic distortion.
The model-selection horse race tested OLS regression, three penalized regressions (Ridge, Lasso, ElasticNet), three tree ensembles (Random Forest, Extra Trees, Gradient Boosting), a neural network, and a SARIMAX time-series model — all using the identical predictor set. The winner was SARIMAX with an AR(1) error structure and exogenous regressors. That result is worth pausing on: SARIMAX nests OLS as a special case, plus adds the assumption that the residuals are themselves serially correlated. The fact that it improves on plain regression tells us that the errors the model makes today are informative about the errors it will make next month — there is structure in the residuals that a simple linear model leaves on the table. The penalized regressions did roughly as well as OLS; the tree ensembles and the neural network did meaningfully worse. The data picked the boring time-series model, with one specific upgrade over plain regression. That is the right model.

Running the model on April's data, the nowcast for May points to continued slow growth — broadly consistent with the 55,000 three-month average for private payrolls. The model points to around 59,000 private payroll jobs in May, with an empirical confidence interval that spans roughly −22,000 to 141,000.
That is not a forecast of collapse. It is a forecast of more of the same. Private hiring continues at a pace that is slower than the 150,000 monthly average of 2022–2024 and slower than what the economy needs to absorb new entrants without the unemployment rate drifting higher.
What this tells us
April's report does not say the labor market is breaking. It says the labor market has decelerated. The composition is narrow. The federal-employment drag is real. The income side — hours, real wages, labor-force participation — is softer than the headline payroll number suggests.
The single most important sentence from this report is the involuntary-part-time number. When 445,000 workers move into "want full-time but cannot find it" in a single month, the labor market is telling you that hiring intentions are weakening even though firings have not picked up. That is exactly how a soft labor market looks in its early stages — slow hiring, cut hours, postponed layoffs.
Friday's May report will be the first real test of whether the establishment survey is starting to move in the direction the household survey already points: noticeably weaker. A private-payroll print near 59,000 with another rise in involuntary part-time work would confirm the trajectory.
The confidence interval around that 59,000 forecast is wide. Either a meaningfully stronger or weaker print would be consistent with the model. But the central case is more of the same.
The labor market is not collapsing. It is not strengthening. The most honest description is the one the data keeps repeating: stabilizing in a low-hire, low-fire equilibrium, not accelerating. For the next several months that is the operating assumption.
Subscribe for the next one.
Sources: U.S. Bureau of Labor Statistics, Employment Situation Summary (April 2026). Forecast model is a one-month-ahead SARIMAX nowcast with AR(1) error structure and exogenous regressors, trained on the monthly data, 1967–present, excluding February 2020 through June 2022 to limit pandemic distortion. Target variable is the monthly change in private payrolls. Model selected by real-time one-step validation against eight alternatives. Predictors: two lags of payroll change, three-month moving average of payroll change, four-week change in initial and continuing unemployment claims, and lagged change in government employment. Empirical forecast interval is the ±1.96 × historical RMSE band.