Risk repriced: the term premium is on the rise
The 10-year Treasury is climbing into the April PCE print, and the headlines will frame it as an inflation scare or a growth story. The component decomposition shows it's neither.


April's PCE print will get framed as an inflation scare or a growth story. The decomposition shows it's neither.
The 10-year Treasury is climbing into the April PCE print, and the headlines will frame it as an inflation scare or a growth story. The component decomposition shows it's neither — it's a higher term premium, driven by fiscal supply and policy uncertainty. That distinction matters. In that world, the Fed can ease the front end of the curve but can't reach the long end where the cost of capital actually lives. With a labor market already weakening, that's the risk worth pricing.
Two stories are circulating to explain it.
The first is an inflation scare: tariffs are still feeding through, oil shocked higher, the recent prints have been hot, and the Fed is back in play. The second is a growth story: AI-driven productivity is lifting the economy's potential, so real rates are rising to match.
Both are plausible. Neither shows up cleanly in the data.
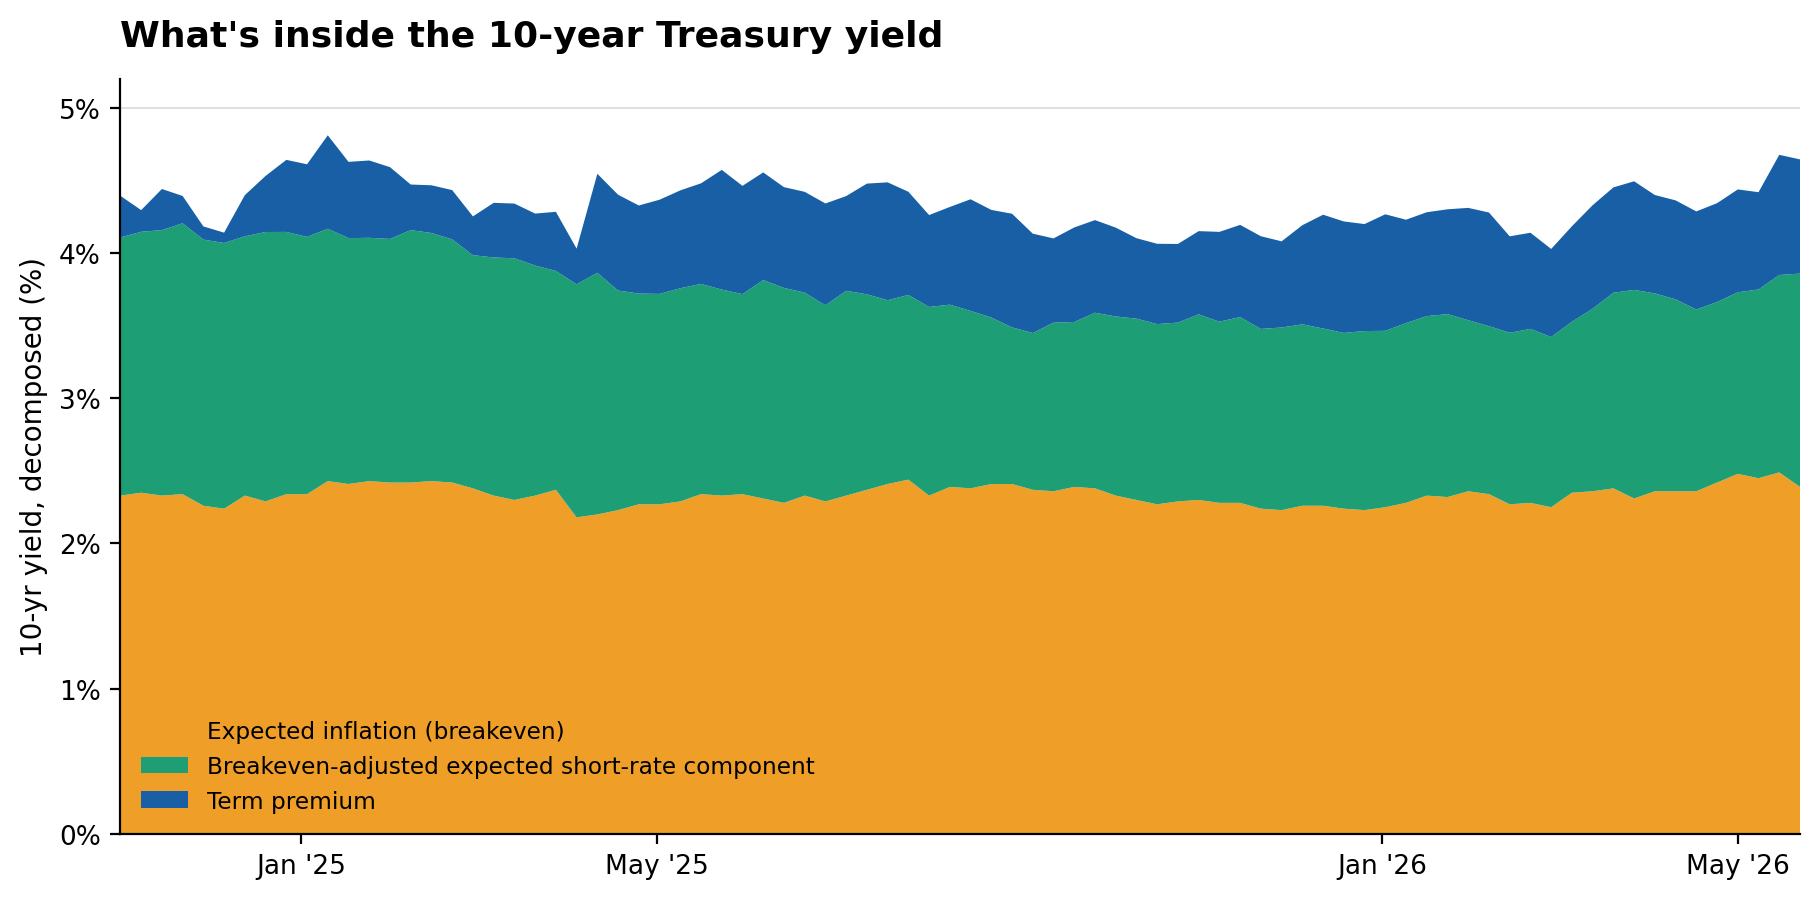
To see why, separate the 10-year yield using two complementary decompositions. In market prices, a nominal Treasury yield equals a real yield plus inflation compensation, measured by the gap between nominal Treasuries and TIPS. In term-structure models, the same nominal yield equals the expected average short-rate path plus a term premium — the extra compensation investors demand to hold a long-duration bond instead of rolling over short-term debt. To get a three-part view, I use the 10-year breakeven as the inflation-compensation component, subtract that breakeven from the ACM expected short-rate component to create a breakeven-adjusted real-rate proxy, and then add the ACM term premium. As a cross-check, I compare the term-premium result with the Federal Reserve Board’s Kim–Wright model. None of these measures is perfect, but together they show whether the move is coming from inflation compensation, expected Fed policy, or the price investors demand to hold duration.
| Decomposition | Identity |
|---|---|
| Observable (market prices) | Nominal yield = real yield + inflation compensation |
| Model-based (term-structure) | Nominal yield = expected short-rate path + term premium |
Here's what they show.
Inflation compensation: contained
The 10-year breakeven has mostly sat in a 2.2%–2.5% band and is near 2.4% today (as of the last week of May, 2026). That's where it has been through tariff pass-through, an energy shock, and headline PCE prints above 3%. A genuine inflation-expectations problem would likely show up in materially higher long-run inflation compensation. It hasn’t.
There's a reasonable pushback here: the Fed has been repricing in response to inflation, so why should I call inflation expectations contained? The answer is in the horizon. The 10-year breakeven is a ten-year average. A flat ten-year average is fully consistent with the market expecting hot inflation now, provided it also expects the Fed to bring it back down later. That's exactly what the data shows: higher inflation priced in the short run, contained over the long run.
The market isn't betting inflation runs. It's betting the Fed wins. That's credibility, not de-anchoring.
Real rates: not in the curve either
If the move were about AI lifting potential growth, you would expect the breakeven-adjusted real-rate proxy — the part of the curve that should embed expectations about the neutral real rate — to be rising. Over the past 18 months, it has drifted down.
The recent month's bounce has been small (about 25 basis points off the lows) and it sits well below where this proxy was in late 2024. A durable AI-productivity story should be putting clear upward pressure on this proxy. It isn’t.
This isn't a clean read — the underlying measure embeds risk and liquidity premia, and the level is model-dependent — so I make only directional claims about it. But the direction is the point: the curve is not pricing AI as a durable, economy-wide shock to potential growth. That bet lives in equities, near record highs. It does not live in bonds.
Term premium: up — and over the multi-year horizon, it's the entire story
The term premium is the part of long yields that compensates investors for risk and supply: heavy Treasury issuance, fiscal-deficit concern, the absence of the Fed as a large-scale buyer of duration, and policy-path uncertainty including around the Fed leadership transition.
Over the past month, it accounts for about half the move. Over three years, it accounts for essentially all of it.
The math is striking. On the ACM model, the 10-year yield is up about 107 basis points over three years. The expected short-rate component is down 36 basis points over the same window. The term premium is up 143 basis points. The Kim–Wright model disagrees on the magnitude (it shows about 84 basis points on the term premium) but agrees on the direction and on the punchline: A higher term-premium explains most or all of the multi-year rise in long yields.
Why "what's driving it" matters more than the move itself
Each component answers a different question. De-anchored inflation expectations would push yields even higher, force tighter Fed policy, and compress earnings — bad for investors. A durable productivity-driven lift in the neutral real rate would raise nominal yields alongside real growth — good for equities, because the move would be a symptom of a bigger economy, not a binding constraint on it.
A rising term premium is the uncomfortable third option. The Fed can lower the expected short-rate path if the labor market weakens. But that does not guarantee the long end follows one-for-one. If investors are demanding more compensation for duration risk, fiscal supply, and policy uncertainty, the 10-year can remain sticky even as the front end falls — and the long end feeds into mortgage rates, corporate borrowing costs, and the capex hurdle rates that actually drive business and household decisions. So the Fed can ease, the front end can fall, and the long end can stay sticky. That’s the part rate cuts cannot easily undo.
Same move in yields, three very different worlds. Only one of them is something the Fed can fix.
What April's PCE actually means
So when PCE prints on Friday May 29, the headline framing — "inflation scare!" or "growth boom!" — will mostly miss the point.
A hot print will reprice the near-term Fed path. That repricing will show up partly in expected short rates and partly, again, in the term premium — because policy-path uncertainty is one of the things the term premium compensates for. What a hot print won’t do, based on the last 18 months, is push 10-year inflation compensation out of its 2.2%–2.5% range.
The headline you'll read on Friday is "yields surge on inflation worries." The actual story is more uncomfortable. The bond market isn't telling you inflation is running, and it isn't telling you growth is accelerating. It's telling you the price of risk has gone up — driven by fiscal supply, an absent Fed buyer, and credibility uncertainty about the policy path itself. That is a higher real cost of capital, and the part of it that lives in the term premium is the part that rate cuts cannot easily undo.
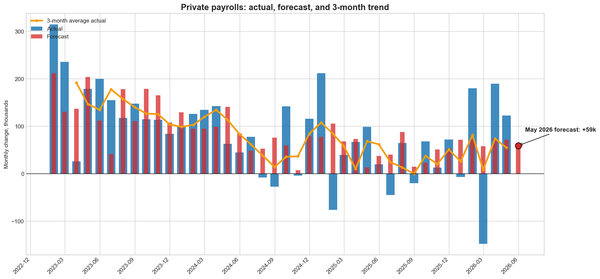
That higher cost of capital is also landing on a labor market where hiring has slowed sharply and real wage growth has weakened. This decomposition is not a recession forecast. But it does point to a riskier backdrop: long rates are staying sticky for reasons the Fed cannot fully control, just as the labor market is losing momentum.