What a Prolonged Stock Slump Could Mean for the Economy and the Fed

Key Takeaways
- Corrections are common and usually brief. S&P 500 declines of at least 10% occur about every 18 months, and corrections short of 20% have taken a median 89 days to hit bottom.
- A 10% stock drop cuts spending about 2%. In my simplified model, retirees cut back most, led by their wealthiest fifth, whose spending falls about 4% initially.
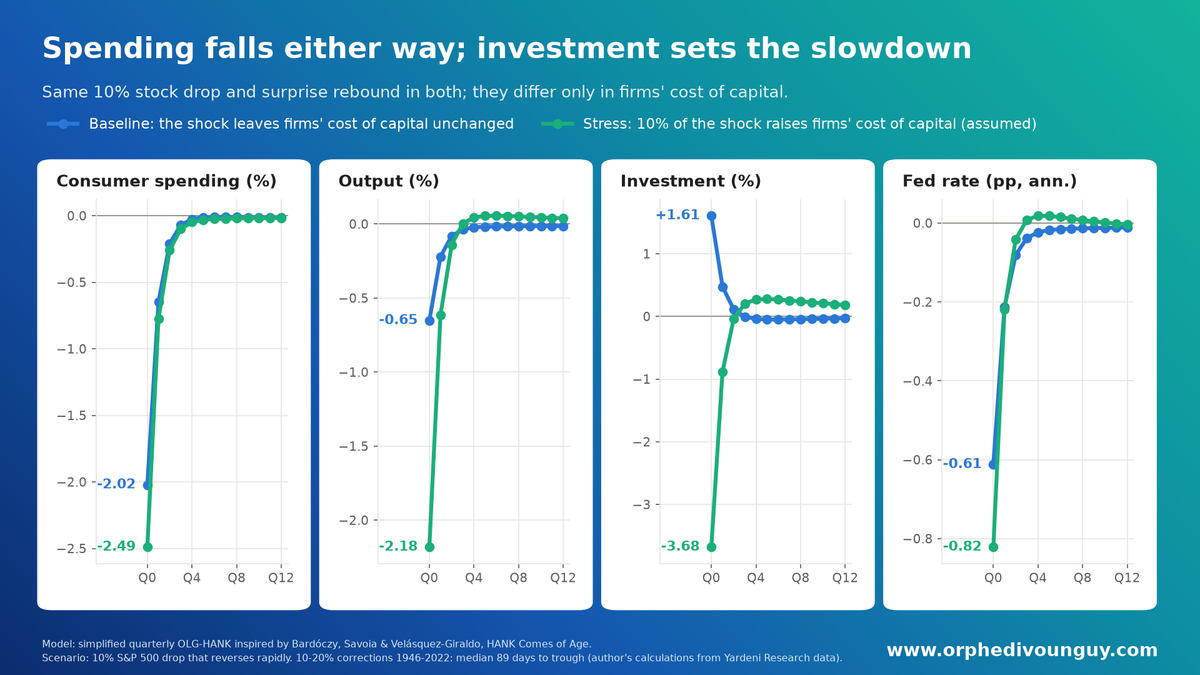
- Investment decides how far the damage spreads. If the shock also raises firms’ cost of capital, output falls 2.2% instead of 0.65%, and unemployment could rise from 4.2% to about 5.3%.
- The Fed faces a harder call. Weaker demand argues for easing, but with inflation still rising, the risk is that the Fed keeps raising rates as spending, investment and hiring weaken.
S&P 500 declines of at least 10% occur about every 18 months, according to Capital Group. For corrections short of 20%, my 1946–2022 sample shows a median 89 calendar days from peak to trough. Guggenheim and Invesco report average recoveries of four to eight months from the trough.
November 23 will mark 48 days since the Nasdaq’s October 6 closing peak. Through Friday, it had fallen 18.1%, the semiconductor index 36.4%, and the VIX closed at 35.89. My calculations put Nebius down 67.5%, Sandisk 61.8%, CoreWeave 56.9% and Nvidia 47.5%.
Investors are reassessing the returns and risks of the AI buildout. The October Fed minutes highlight growing AI debt, opaque financing, concentrated exposures and banks’ indirect exposure through nonbank lenders. These could amplify losses if AI returns disappoint.
Reassessing those risks can reduce valuations even when earnings forecasts rise. Investors appear to be demanding greater compensation for risk.
The bond market suggests further tightening can coexist with growth concerns. Friday’s two-year Treasury yield, 4.63%, stood 0.76 percentage points above the Fed’s target range for the policy rate; the ten-year yielded 4.92%, 0.29-point above the two-year. Both fell, consistent with demand for safety. A roughly 0.99-point estimated ten-year term premium reflects inflation and interest-rate uncertainty. High yields compete with stocks and raise financing costs, while investors seek protection against weaker growth.
I simulated a temporary 10% stock-price decline caused by higher required equity returns. In the simplified model, consumption falls about 2% initially and averages 0.7% below baseline during the first year. Retirees cut spending most, led by their wealthiest fifth, whose spending falls about 4% initially.

Investment matters for how much the shock spreads. In the baseline, policy easing supports investment and output falls 0.65%. In a stress scenario where an assumed 10% of the equity-premium shock also raises firms’ investment discount rate, consumption falls 2.5%, investment 3.7% and output 2.2% initially.
Translating output losses into unemployment using an assumed rule of thumb gives initial increases of about 0.3 and 1.1 percentage points, respectively. An illustrative starting rate of 4.2% could go up to about 5.3% in the stress scenario.

Both scenarios assume a 10% stock-price drop in the initial quarter, followed by a rebound that recovers 90% of the loss within two quarters—about six months. A more prolonged drawdown could extend the spending drag, while persistent uncertainty could delay investment and weaken younger workers’ job prospects.

Weaker demand could ease inflation pressure and strengthen the case for holding rates steady or eventual cuts. The model’s inflation-based rule produces 60–80 basis points of temporary easing. Actual Fed policy will depend on whether spending weakness translates into lower inflation and softer employment.
For now, inflation is still pushing in the wrong direction. Continued Middle East disruptions could keep energy expensive even as growth slows. Consumer-price pressure can persist after oil prices retreat. Tariffs add price pressure, while persistent government borrowing could keep financing costs elevated. My October nowcast puts annual PCE inflation at 3.8% and core inflation at 3.2%, both above September. Fuel-intensive categories account for much of the recent producer-price increase, consistent with earlier energy costs passing through gradually.
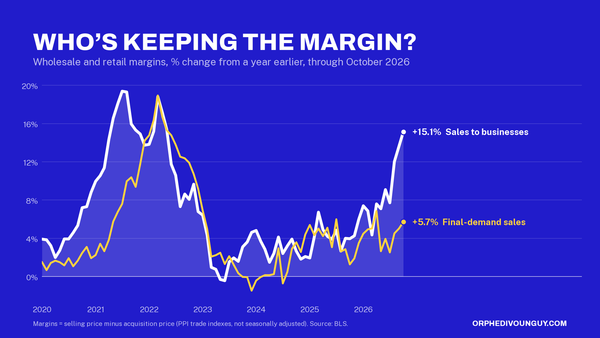
But weaker consumer spending could limit businesses’ ability to pass higher costs on to customers. Firms may absorb more through narrower margins, potentially prompting further cuts to hiring and investment. If the stock market drawdown deepens and inflation remains elevated, the risk is that the Fed continues raising rates even as household spending, business investment and hiring weaken.
Federal funding also expires December 11. Senate appropriators’ November 16 drafts still require enactment. A shutdown could delay paychecks, disrupt contractors and postpone decisions—adding to the risk of weaker growth alongside stubborn inflation in the near term.