The Fed's Preferred Inflation Gauge Is Headed Higher. The Oil Shock Is Still Working Its Way Through.

Key Takeaways
- October points higher. My nowcasts put headline PCE inflation at about 3.8% over the year and core at 3.2%, with the three-month core pace near 3.3%. Energy stopped driving the monthly PPI increase directly. Freight, food, chemicals and construction rose instead, a pattern consistent with delayed fuel-cost pass-through.
- Business customers are absorbing higher costs; pricing power looks weaker in discretionary retail. Margins on business sales rose, while several discretionary retail margins fell. The question is how much more customers will absorb as earlier fuel and freight costs work through the supply chain.
- The Fed should hike a quarter point in December. Persistent inflation and resilient activity support further tightening. A half-point move would require clearer evidence that inflation is becoming entrenched: accelerating core services inflation excluding housing, price increases spreading beyond fuel-sensitive categories, or renewed increases in longer-run inflation expectations.
What happened
Consumer prices rose 0.4% in October and core prices rose 0.3% for a third consecutive month. Final-demand producer prices rose 0.3%, following September’s upwardly revised 1.4% jump. Their annual increase reached 6.5%, the largest since November 2022.
PPI measures prices received by domestic producers. Final demand includes consumption, investment, government purchases and exports. For wholesalers and retailers, it measures margins on goods resold. Final demand is therefore broader than household spending.
My breakdown shows how October’s increase shifted away from energy itself and toward the businesses that use it.
| Component | Share of index | October change | Contribution |
|---|---|---|---|
| Transportation and warehousing | 5.2% | +2.0% | 0.11 pts |
| Goods excluding food and energy | 18.2% | +0.55% | 0.10 pts |
| Services excluding trade and transportation | 42.5% | +0.19% | 0.08 pts |
| Food | 5.2% | +1.3% | 0.07 pts |
| Construction | 2.6% | +1.8% | 0.05 pts |
| Wholesale and retail margins | 19.5% | −0.24% | −0.05 pts |
| Energy | 6.8% | −0.13% | −0.01 pts |
Transportation and warehousing added the most, with truck freight up 3.9% despite diesel falling 7.9%. Goods excluding food and energy rose 0.55%, including a 3.9% increase in basic organic chemicals. Food rose 1.3% and construction 1.8%. Other services rose just 0.19%.
Energy subtracted about 0.01 percentage point from the monthly increase, after supplying about half of September’s jump. Excluding energy, producer prices rose 0.38% in October and 4.9% over the year, up from 4.7% in September. Excluding food, energy and trade margins, the annual rate eased to 4.9% from 5.0%. Inflation outside energy remains elevated, but the measures do not show a uniform acceleration.
Fuel-intensive categories account for much of the increase, consistent with earlier energy costs reaching contracts and price lists gradually. Fuel surcharges, contracts and inventories can delay adjustment: businesses may still be recovering earlier cost increases even after diesel falls. That creates a risk that consumer prices keep rising after the direct energy contribution fades.

What the oil research supports
Alp, Klepacz and Saxena (2023) estimate that an oil-price increase gradually lifts core consumer prices across 27 advanced foreign economies, with the effect building over about two years. A shock can therefore keep inflation elevated well after oil stops rising, even though its eventual effect is a higher price level rather than permanently faster inflation.
De Michelis and coauthors (2026) find stronger post-pandemic oil pass-through and inflation persistence across five major economies, including the United States. Their findings warn against assuming that the pre-pandemic pattern of limited pass-through will return, although they do not establish that the change is permanent.
For the United States specifically, Joel Prakken (2026) finds that fuel used to produce and transport consumer goods and services can raise core PCE inflation. Core excludes consumers’ direct energy purchases; it does not exclude the fuel costs embedded in everything else. Falling gasoline prices alone therefore do not resolve the Fed’s problem.
The policy concern is that repeated cost shocks keep inflation high long enough to influence wage and price setting. Softer survey expectations are reassuring, but the Fed cannot assume that households and businesses will indefinitely look through higher living costs.
Where margins diverged
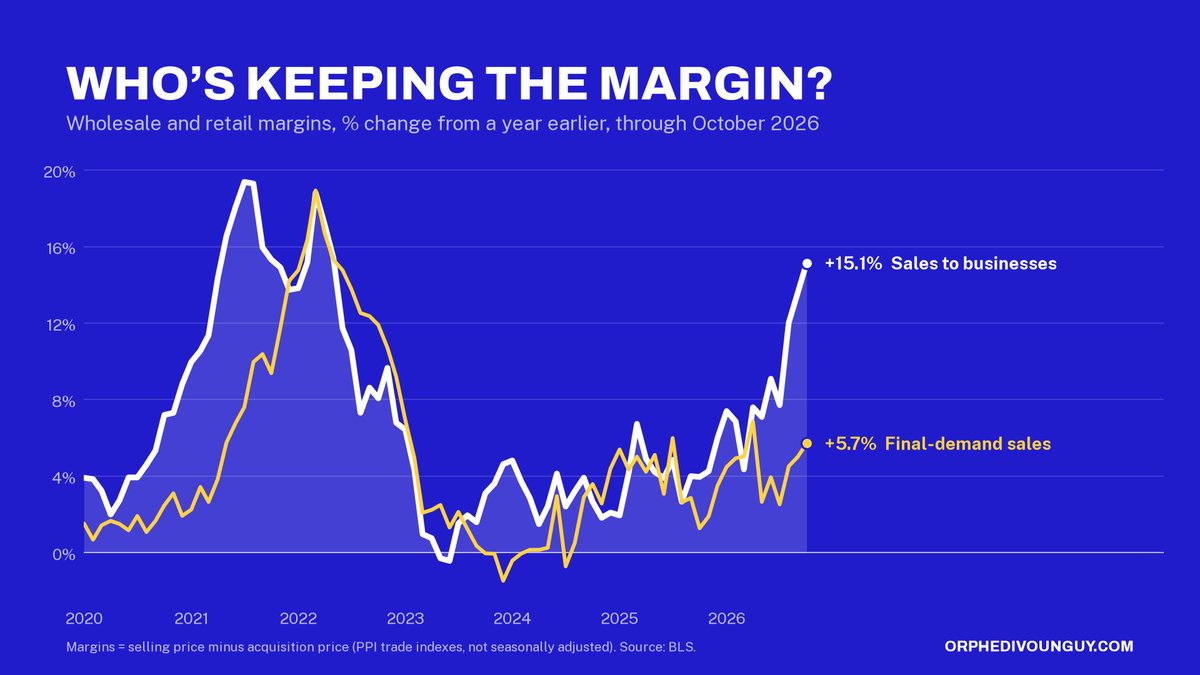
Trade margins on sales to businesses rose 1.6% in October and 15.1% over the year. Final-demand trade margins fell 0.24%, after September’s revised 2.09% increase.
Retail margins fell for computers (16.8%), appliances (8.4%), sporting goods (6.3%) and TV, video and photographic equipment (2.6%). Food and alcohol wholesaling margins rose 4.2%. Gas station margins rebounded 22.2% after falling 18.9% in September.
The split suggests uneven pricing power: sellers of several discretionary goods accepted narrower margins while some sellers of essentials widened theirs. That is consistent with pressure on shoppers’ budgets, although margins alone do not measure purchases. Wider margins also help cover freight, wages and financing; they are not net profits.

The October PCE nowcast
Last month, I estimated September headline PCE at +0.48% and core at +0.27%. BEA subsequently reported increases of 0.5% and 0.3%, respectively. Both forecasts were close. October’s estimates point to another increase in the annual rates, to about 3.8% headline and 3.2% core:
| Measure | Monthly estimate | Approximate 80% range | Annual rate | Three-month annual pace |
|---|---|---|---|---|
| Headline PCE | +0.29% | +0.20% to +0.37% | 3.79% | 4.49% |
| Core PCE | about +0.25% | +0.15% to +0.34% | 3.19% | 3.34% |
Core’s three-month annualized pace would reach 3.34%, above its 3.19% annual rate. In last month’s article, the projected three-month pace was still below the annual rate. The new estimate suggests that recent momentum is firming even as the direct energy shock subsides. Headline’s three-month pace would remain considerably faster, at 4.49%.
BEA has an October 2025 PCE estimate, despite missing CPI data during the shutdown. It filled missing CPI inputs using September and November prices, so the annual PCE comparison is available but incorporates imputed prices in its base.
What it means for households
Average hourly earnings rose 3.1% over the year, below the nowcast’s 3.8% PCE inflation rate. That suggests pressure on purchasing power, though average earnings do not measure every household’s income. Real consumer spending was roughly flat in September. Consumers can face relief at the pump while still paying more for food and services as earlier fuel costs work through the economy.
What it means for wholesalers and distributors
Distributors face pressure from both what they buy and what it costs to move. Goods excluding food and energy rose 0.55% in October, while truck freight rose 3.9% and 24.6% over the year. Diesel’s decline offers possible relief, but the timing depends on surcharges, contracts and other transportation costs. Business-sales margins are rising; several discretionary retail margins are falling. The question is how much customers will absorb as those costs arrive. Another hike would also raise inventory financing costs on floating-rate debt.
What it means for the Fed
The Fed held its target range at 3.75%–4.00% on October 28; Lisa Cook and Beth Hammack preferred a quarter-point increase. Its statement described economic growth as strong. October added 165,000 jobs, while annual wage growth was 3.1%.
My earlier warning signs give a mixed signal. PPI excluding energy rose 0.38%, below my 0.5% threshold, and other producer services slowed. Michigan’s year-ahead expectations eased to 4.3% from 4.7%, and long-run expectations to 3.4% from 3.5%. Those declines favor a measured response, though expectations remain elevated against earlier benchmarks.
The case for tightening rests on persistence: inflation has remained above target for years, activity is resilient, and the nowcast points to firmer core momentum. Repeated supply shocks can delay the return to 2% even without a wage-price spiral. But tighter policy works through demand, cannot directly reverse an oil disruption, and September’s hike is still working through the economy.
Before October’s CPI release, Waller said core inflation around 0.3% or higher would warrant considering a half-point December hike. October met that condition. He also pointed to elevated inflation in core goods and market-based services excluding housing, making the case for a larger move serious. I still favor a quarter point because inflation expectations have eased, October core PCE is projected to rise about 0.25%, and September’s tightening is still working through the economy. A core PCE increase of 0.35% or more on November 25 would strengthen the case for a larger move, especially if accompanied by accelerating services inflation beyond fuel-sensitive categories.
The composition matters as much as the total. I would look for accelerating core services excluding housing—supercore—with rising three- and six-month annualized rates and increases spreading beyond fuel-sensitive categories. PPI’s “other services” index is not that measure. Broader supercore pressure or renewed increases in longer-run expectations would make a half-point hike more compelling. A quarter point is my judgment about the balance of risks, not a conclusion supplied by the nowcast alone.
Sources
BLS October 2026 PPI, CPI and employment releases; BEA September 2026 Personal Income and Outlays; October 28 FOMC statement; Waller, November 10; Michigan preliminary November survey. Oil research: Alp, Klepacz and Saxena (2023); De Michelis, Orak, Pradhan and Queralto (2026), FEDS Notes. Contributions and nowcasts: QRG. Ranges are approximate, not official forecasts.
Links: PPI; BEA; Oil research 2023; Oil research 2026; Waller; September article; Prakken (2026); October 2025 PCE.