Even the biggest job creators are hiring more slowly than they used to

Key Takeaways
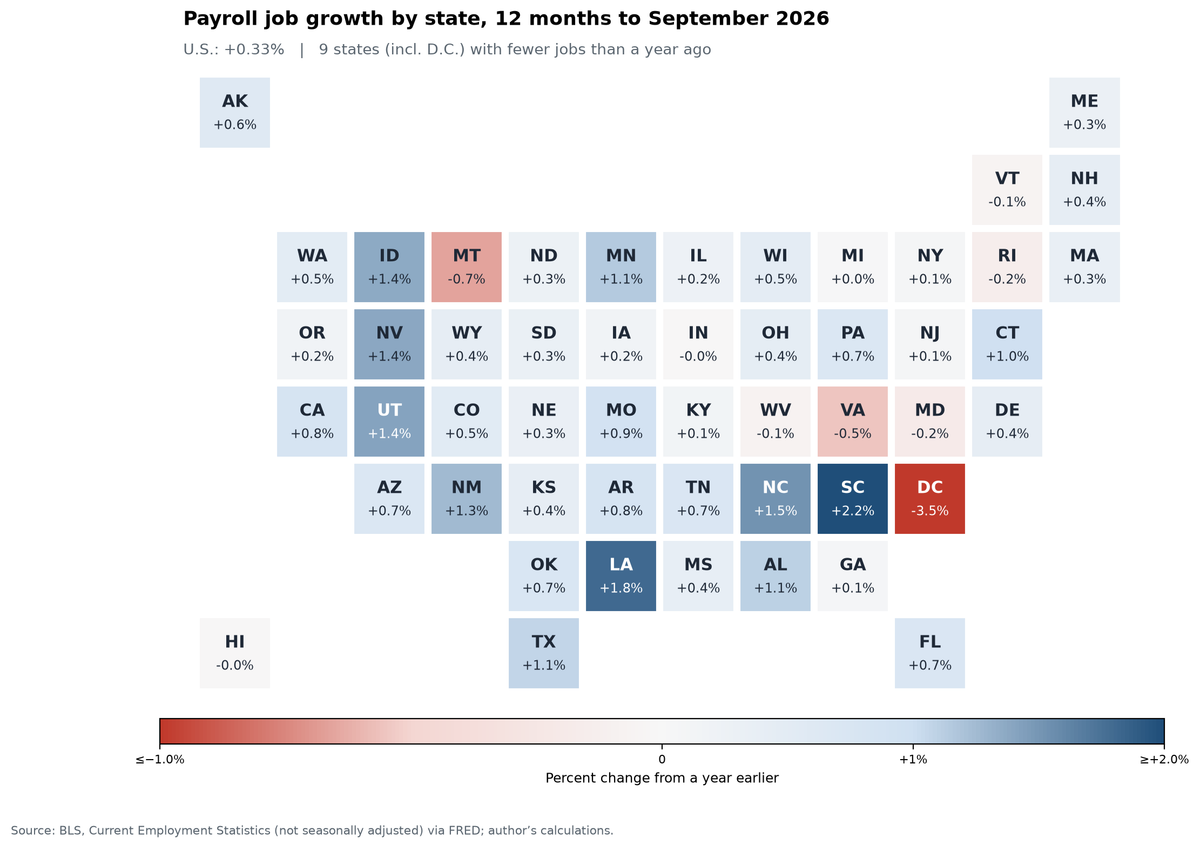
- Even the biggest gainers have experienced a slowdown. Texas added 154,300 jobs over the year, more than any other state, but its 1.08% growth was less than half its 2.34% yearly pace in the 2010s.
- South Carolina is the exception. Its jobs grew 2.31% over the year, faster than in the 2010s, and its hiring sped up to a 5.33% yearly rate over the last three months.
- A lower unemployment rate isn’t always good news. Maryland’s rate fell to 3.9% even as its payroll jobs and labor force both shrank.
Texas added more jobs than any other state over the past year, but its hiring pace was less than half its pre-pandemic growth rate. September’s state and metro employment figures show a similar pattern across much of the country: some markets are picking up speed, while others are barely adding jobs or losing them.
Job growth has slowed across much of the country
The number of jobs on U.S. employer payrolls grew about 0.37% over the 12 months through September. During the 2010–2019 economic expansion, it grew 1.58% a year. That comparison period leaves out both the Great Recession and the pandemic. The earlier expansion provides a historical reference, although slowing population and labor force growth mean today’s economy may not need to sustain the same pace of job creation to keep the unemployment rate from rising.
Twenty-eight states saw faster employment growth than the nation over the past year. But beating a slow-growing national labor market is a low bar.
Big job gains, slower growth
Texas shows the difference. The state added 154,300 jobs over the year, an increase of 1.08%. From 2010 through 2019, it added about 267,300 jobs a year on average and grew 2.34% a year. The pace needed to keep unemployment steady depends on how fast the labor force grows, rather than the pace of hiring in the last expansion. Texas’s labor force was nearly unchanged over the past year. That does not establish that the state is adding enough jobs: its historical growth rate is a comparison point, not an estimate of the hiring needed to keep unemployment steady.
The same pattern showed up in three other leading job creators. California added 129,300 jobs, but its 0.72% growth rate trailed its 2.14% pace in the 2010s. North Carolina added 67,000 jobs, growing 1.32% compared with 1.87% before. Florida added 59,800, growing just 0.60% compared with 2.43% before.
South Carolina was the exception among the five states that added the most jobs. Its 55,200 new jobs amounted to 2.31% growth, faster than its 2.08% pace in the 2010s. These conclusions still hold if we compare with 2015–2019 instead, which leaves out the years when the economy was still recovering from the Great Recession.

A strong September in several states
September brought stronger hiring to several states. New York added an estimated 19,600 jobs, well above its typical monthly gain of about 11,100 before the pandemic. New Jersey added 14,900 compared with a typical 2,900, and South Carolina added 12,500 compared with 3,400. Virginia’s 7,800 and Oregon’s 5,800 new jobs also topped their earlier monthly averages.

Which states are speeding up, and which are slowing down
Comparing the last three months with the three months before shows which economies are gaining momentum and which are losing it. To make the periods easy to compare, I convert each three-month change into the rate it would produce over a full year.
South Carolina’s job count grew at a 5.33% yearly rate from June to September, up from 1.69% in the previous three months. Louisiana, Nevada, New Mexico, Arkansas and Washington also sped up.
Texas moved in the opposite direction. Its job count edged down at a 0.14% yearly rate in the latest three months, after growing at a 2.03% rate in the three months before. Minnesota and Arizona also went from hiring in the spring to small job losses in the summer. These yearly rates describe how fast hiring has been moving recently.

Metro areas tell a similar story

Jobs in Dallas–Fort Worth grew 0.84% over the year, well below the area’s 2.86% yearly pace in the 2010s. Over the last three months, its job count declined at a 0.6% yearly rate. Raleigh grew 2.07% over the year, compared with 2.86% before the pandemic, and its recent pace slowed further, to a 1.28% yearly rate.
Las Vegas improved. Its job count grew at a 4.47% yearly rate over the last three months, faster than its 1.87% gain over the full year. But even that full-year gain fell short of its 2.63% pace in the 2010s. A local economy can be picking up speed and still fall short of how it used to perform.
Elsewhere, job creation nearly stopped. Jobs in the New York metro area grew 0.30% over the year, Denver’s grew 0.10%, and Chicago’s slipped 0.03%. The Washington, D.C., metro area had 66,800 fewer jobs, a 1.99% decline. Indianapolis, Portland, Richmond and Baltimore also had fewer jobs than a year earlier.
Of the 380 metro areas I analyzed, 137 had fewer estimated payroll jobs than a year earlier. In its separate report, which does not adjust for normal seasonal swings, the Bureau of Labor Statistics reported statistically significant job losses over the year in Washington; Bloomington, Indiana; and Flagstaff, Arizona.

A falling unemployment rate isn’t always good news
The unemployment rate can hide these weaknesses. Maryland’s rate fell from 4.3% to 3.9% over the year, even though the number of payroll jobs in the state fell 0.50%. Over the same period, its labor force—the number of people working or looking for work—shrank 0.79%. The share of people age 16 and older working or looking for work fell 0.7 percentage point, to 63.7%.
In the Washington, D.C., metro area, unemployment fell from 4.1% to 3.8%, while the labor force shrank 2.04%.
A lower unemployment rate tells a positive story when more people are working and more people are joining the labor force. South Carolina shows that combination. Its labor force grew 2.19%, labor force participation rose 0.3 percentage point, and unemployment fell from 4.7% to 4.0%.
The national figures describe a labor market that is still growing, but slowly. The state and metro figures show where that growth is coming from. South Carolina and Las Vegas are picking up speed, while Texas’s recent hiring has weakened and the Washington, D.C., region has fewer jobs than a year ago. Over the next few months, I’ll be watching whether Texas’s summer slowdown continues, and whether falling unemployment rates in places like Maryland reflect more residents finding work or a shrinking labor force.
Sources
- U.S. Bureau of Labor Statistics, State Employment and Unemployment, September 2026: bls.gov. Metropolitan Area Employment and Unemployment: bls.gov.
- BLS payroll and labor force data via FRED. Historical national and state series: PAYEMS; TXNA; CANA; NCNA; FLNA; SCNA; NYNA; NJNA; VANA; ORNA. Metro series: DALL148NA; RALE537NA; LASV832NA.
- U.S. Bureau of Labor Statistics, labor force definitions.
- Historical annual growth rates are compound rates from December 2009 to December 2019. Historical monthly job gains average the 120 monthly changes from January 2010 through December 2019. The 2015–2019 comparison uses December 2014 through December 2019. Article payroll comparisons and charts use seasonally adjusted estimates; the separately cited BLS metro release reports unadjusted annual comparisons. The analysis covers 380 metros; the BLS release covers 387. “50 largest” refers to payroll employment, not population. Metro chart labels use the primary city and state suffix for brevity.
- Map locations: U.S. Census Bureau, 2024 Gazetteer metropolitan area representative coordinates: census.gov. Map outlines: PublicaMundi MappingAPI U.S. states GeoJSON.
- Labor force participation is measured among the civilian population age 16 and older living outside institutions. The article uses “people age 16 and older working or looking for work” as a plain-language description. State payroll jobs and resident labor force counts are different measures; the Texas comparison does not estimate a payroll job growth threshold for stable unemployment.