October Homebuilding: A Bounce to Discount, and Pricing Power Drifting Up-Market

Key Takeaways
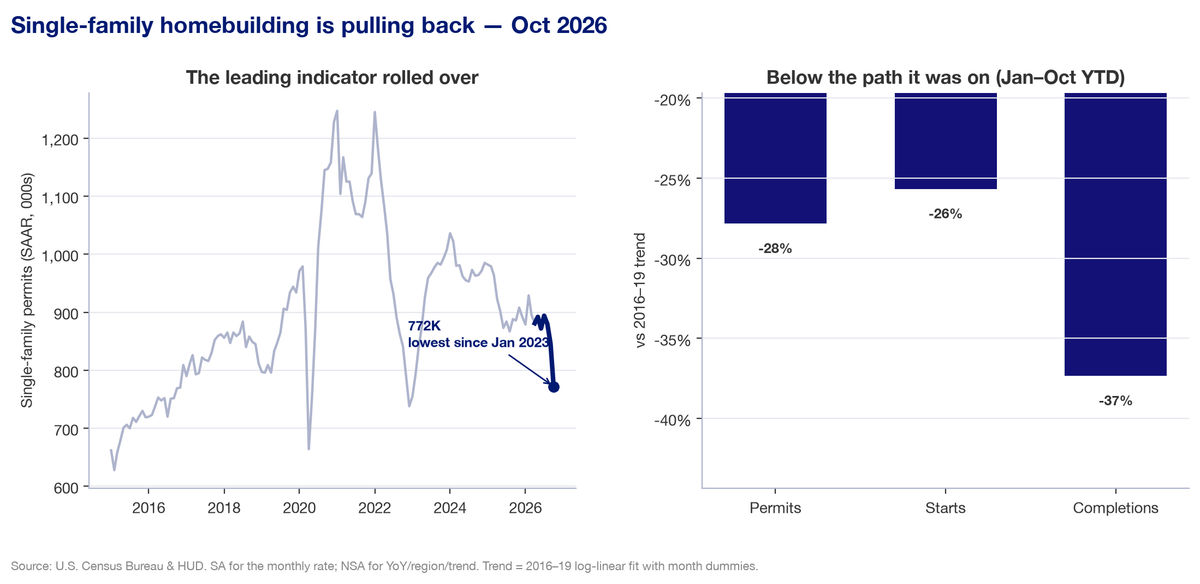
- Starts increased, but the pipeline is shrinking. For the month, starts rose 9.9% and completions 6.5%, but permits — which tell you what’s coming next — fell 7.4%. Single-family permits dropped to a 772,000 annual rate, their lowest since January 2023.
- The pullback is still mostly a single-family story, and still a Sun Belt one. Single-family permits and starts are falling while multifamily starts run above their pre-pandemic path. Single-family building remains ~59% concentrated in the South, even as multifamily authorizations rotate toward the West and Midwest.
- The pricing power has moved up-market. Luxury prices rose 4.7% over the year on shrinking inventory; non-luxury rose 1.6% on rising inventory. Demand at the top end of the market is holding up, and that resilience may be an opportunity for builders.
The headline numbers
- Building permits fell to a 1,295,000 seasonally adjusted annual rate (SAAR) — down 7.4% for the month and 8.7% below a year ago. Single-family permits dropped to 772,000 (−8.7% for the month), their lowest rate since January 2023. Permits for buildings with five or more units were 475,000.
- Housing starts rose to 1,309,000 — up 9.9% from September and 2.8% above a year ago. Single-family starts were 864,000 (+4.0% for the month); 5+ unit starts were 433,000. Note the error band: the 90% confidence interval for the monthly change in starts runs from a 6.9% decline to a 26.7% increase — so the estimated rebound is not statistically distinguishable from zero.
- Housing completions rose to 1,272,000 — up 6.5% from September but 10.4% below a year ago. Single-family completions were 900,000 (+6.3% for the month); 5+ unit completions were 362,000.
All levels above are seasonally adjusted annual rates. Monthly and annual changes compare those adjusted rates. The year-to-date figures below use unadjusted counts.
What happened
Although starts and completions both increased, the monthly starts number carries a confidence interval wider than the change itself, and it follows a weak September — one month’s increase is not enough to establish a recovery.
The bounce is also flattered by revisions. The Census Bureau revised September starts down — total starts from 1,221,000 to 1,191,000, and single-family starts from 859,000 to 831,000. Measured against what was originally reported for September, total starts rose 7.2% for the month rather than 9.9%, and single-family starts just 0.6% rather than 4.0% — essentially flat. September permits and completions changed little in this release; the revisions were concentrated in starts, which made October’s reported rebound larger.
The signal is at the front of the pipeline, and it points down. Single-family permits — the best read on what builders intend to build next — fell 8.7% for the month to a 772,000 rate, the lowest since January 2023. Total permits are now 8.7% below a year ago. The leading indicator didn’t just soften; it set a new multi-year low.
The cause hasn’t changed. Freddie Mac’s 30-year fixed rate averaged about 7.33% in October, up from roughly 6.25% a year earlier, and demand has thinned accordingly.
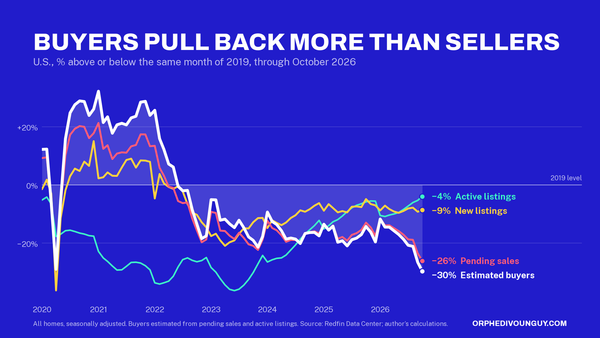
Pending sales fell to their lowest level since April 2020, the buyer pool is down about 18% from a year ago, and active listings are the highest since early 2020. With more listings chasing fewer buyers, builders increasingly lean on rate buydowns and other incentives to reach payment-constrained buyers.
The year-to-date numbers confirm a steady retreat, not a one-month wobble. Through October, and on an unadjusted basis, single-family permits are down 5%, starts down 5%, and completions down 11% versus the same ten months of 2025.
The big picture

The pullback is concentrated in single-family. Year-to-date, single-family permits and starts are each down about 5%, while multifamily permits are up 2% and starts up 7%. Completions are falling for both — that’s the tail of the pandemic-era building wave finishing — but at the forward-looking stages, the two sectors are moving in opposite directions.

Multifamily isn’t the problem. Permits were at a 523,000 annual rate in October — about 36% below their February 2023 peak, but above their 2024 low. Measured against an extrapolation of the 2016–19 trend on a January–October basis, multifamily is mixed rather than weak. The apartment pipeline is still being fed. Single-family, by contrast, has weakened more.

Geography is where the strategy question starts.
Although single family permitting activity has fallen across the board, single-family building is — and stays — a Sun Belt story: the South accounts for about 59% of single-family permits, essentially unchanged from 2024.
The metro figures, which run through September, show substantial single-family permit declines in several Sun Belt markets — Las Vegas (−28%), Charlotte (−23%), Cape Coral (−27%) and Phoenix (−13%) — while permits rose in Boston (+22%), Kansas City (+15%), Columbus (+11%), Cleveland (+9%) and San Francisco (+10%).
The geographic distribution of multifamily authorizations, meanwhile, has shifted away from the South (46% → 41% of permits since 2024) toward the West (22% → 25%) and Midwest (16% → 18%). Single-family authorizations remain similarly concentrated there.
A divergence worth watching: the pricing power is up-market
Step back from the month-to-month moves and a structural divergence stands out. Single-family permitting remains concentrated in the South. Where competing inventory is abundant and buyers are affordability-constrained, mortgage-rate buydowns and other incentives can help builders sustain sales volume — but they are a margin cost.
Meanwhile, the pricing power has moved up-market. Over the three months through October, luxury prices rose 4.7% from a year earlier while luxury inventory fell 2.2%; non-luxury prices rose just 1.6% as non-luxury inventory rose 1.3%.
The median luxury sale price rose about three times as fast as the median non-luxury price, on tightening supply, against buyers who are far less sensitive to a 7% mortgage because many aren’t using a mortgage at all.
The pockets of pricing power are in the luxury sector in Midwest metros like Chicago, Indianapolis, St. Louis and alongside the Bay Area (San Jose and San Francisco) — where single-family building is lightest and where housing inventory is lowest when compared to before the pandemic. The glut sits where new construction is heaviest, in the Sun Belt.
Read as an observation rather than advice, the divergence raises a useful question for builders: are there opportunities in markets where high-end supply remains limited — the supply-constrained Midwest and Bay Area markets, where single-family builders are only lightly exposed? Answering it means weighing local buyer demand, land availability and construction costs. For now, scarcity, not incentives, is doing the pricing work, and scarcity sits mostly where the building isn’t.
The caveats are real. Land pipelines are set years in advance, so builders can’t pivot in a quarter; luxury is a smaller-volume, longer-cycle segment; and buydowns genuinely help affordability-constrained buyers clear a 7% rate.
The bottom line
October’s starts bounce doesn’t change the trajectory. Single-family permits — the part of the report that tells you what’s coming — fell to their lowest since January 2023, and the weakness is where it has been all year: single-family, and the Sun Belt.
The subtler signal is about mix, not just level. The pricing power has quietly moved up-market, toward luxury, while the bulk of single-family permitting has stayed in the South. That divergence — and the question it raises about where high-end supply is scarce — is what will shape the next year of homebuilding, more than any single month’s permits number.
Data note: Year-to-date comparisons cover January–October 2026 versus January–October 2025 and use unadjusted counts. Regional shares and trend comparisons use monthly historical observations; the trend extends a 2016–19 log-linear fit with monthly seasonal controls and is an illustrative benchmark, not a forecast. “Multifamily” means units in buildings with two or more units unless otherwise specified. Metro-level permit figures run through September 2026. Redfin defines luxury as the top 5% of the local price distribution and non-luxury as the middle tier, from the 35th to the 65th percentile (rolling three-month periods); the non-luxury comparison does not describe the starter-home market. Those figures are median sale prices and active-listing counts from Redfin’s MLS-based housing data; they do not isolate newly built homes, and median prices are not same-home (repeat-sales) appreciation. Mortgage rates: Freddie Mac. New residential construction: U.S. Census Bureau and HUD.