Revelio vs. LinkedIn: Who Has the Better Read on Jobs?

The race to predict payrolls has no clear champion yet. Revelio is useful, not magical: it beats naive rules, looks about as good as LinkedIn, and belongs on a dashboard of real-time labor-market signals — not in place of the BLS report.
Key Takeaways
- Revelio clears the low bar. Its nowcast beats a zero-growth rule, a prior-month-change rule, and a trailing three-month average on average error, and it calls the direction of payroll growth — accelerating or decelerating — in 9 of 11 months. But eleven months is far too short to call that a durable edge.
- One month runs the calibration story. On the eleven-month first-print sample the Mincer–Zarnowitz slope is 0.32, but June 2026 is extraordinarily influential; excluding it raises the slope to about 1.2. Separately, the longer revised-data relationship has a slope of 1.14, though that is a tracking exercise rather than a real-time forecast test.
- Against LinkedIn, it’s a draw. On the ten months both publish, Revelio has the lower average error (79k vs 83k) and LinkedIn the lower RMSE. Strip out the shutdown months and the MAE lead flips by about a thousand jobs. Either way, there is no clear winner.
- ADP and LinkUp don’t belong in the same table. ADP measures private payrolls (MAE 68k), not total nonfarm. LinkUp’s public archive mixes vintages and leaves just one clean first-print month. Ranking them head-to-head would compare different things.
Every month, a small industry of private trackers publishes an early read on the government’s jobs report before the Bureau of Labor Statistics does. ADP has payroll records. LinkedIn sees hiring and job-search activity. LinkUp sees vacancies. Revelio Labs builds a broad labor-market dataset from professional profiles and job postings. The numbers land before Jobs Friday, get quoted in markets and the press, and get treated as previews of the official print.
An early number is only worth watching if it clears two bars. It has to beat simple rules that need no model at all. And when you stack it against another private read, you have to be sure the two are aiming at the same target.
I put Revelio Public Labor Statistics — RPLS — through both. The verdict is real and small at the same time. Revelio has beaten the mechanical guesses over its short public record. Against a serious rival, LinkedIn’s Economic Graph, the race is a tie.
Grade the right number
RPLS is a nowcast, not a multi-month forecast. It estimates payroll employment for a reference month that has already ended, and in normal release months it publishes shortly before the BLS report — Revelio designs the monthly update to arrive the day before Jobs Friday. The evaluation has to mimic what a reader actually knew in real time. Three choices follow.
Use Revelio’s published first estimate, not a value reconstructed from today’s revised archive. Revelio’s own “Summary revisions” table makes the difference visible: the first release for a month can move materially in later vintages.
Grade it against the BLS first print. Payroll data are revised repeatedly. If the question is whether Revelio anticipated the number the market first saw, the relevant outcome is the BLS value as initially published, rebuilt from the matching ALFRED vintage.
Hold it to mechanical benchmarks. A nowcast should beat guessing zero payroll growth, repeating last month’s payroll gain, or taking a short trailing average.
The public RPLS sample runs August 2025 through June 2026 — eleven observations. That is enough to describe performance. It is not enough to establish a law of nature.
Revelio beats the mechanical rules
On the exact number, Revelio is noisy. Mean absolute error is 86,000 jobs; RMSE is 103,000. It misses the first print by at least 50,000 jobs in 7 of 11 months, and the worst miss — June — is about 202,000. So it is not precise.
Precision is not the test, though. The test is whether the nowcast improves on what a mechanical rule would have told you. It does. Revelio posts the lowest average absolute error of the four rules, and it calls the direction of payroll growth — faster or slower than last month — in 9 of 11 months, against 8 of 11 for the zero-growth and trailing-average rules.

| Rule | MAE | RMSE | Direction |
|---|---|---|---|
| Revelio RPLS | 86 | 103 | 9 of 11 |
| Zero growth | 100 | 111 | 8 of 11 |
| Prior-month change | 124 | 148 | — |
| Trailing 3-month mean | 98 | 111 | 8 of 11 |
That is a real result. It is not a decisive one. Eleven months is a tiny sample for a volatile series, the edge in average error is measured in tens of thousands of jobs, and a single monthly payroll surprise can be several times larger. The safe reading is narrow: RPLS has carried useful real-time information so far. Not that it owns a permanent edge.
One month runs the calibration story
The mean error is about −13,000 jobs, with no sign that Revelio systematically runs high or low. Calibration is the harder question: when Revelio makes a very strong or very weak call, does the BLS move by a similar amount?
On the eleven-month first-print sample, the Mincer–Zarnowitz slope is 0.32 — well below the ideal of one. Read mechanically, that looks like overreaction. June 2026 does almost all of the work: Revelio estimated roughly +258,500 jobs; the BLS first print was +57,000. That one point has a Cook’s distance above 3 — extraordinarily influential in an eleven-point regression. Drop June and the slope rises to about 1.2.
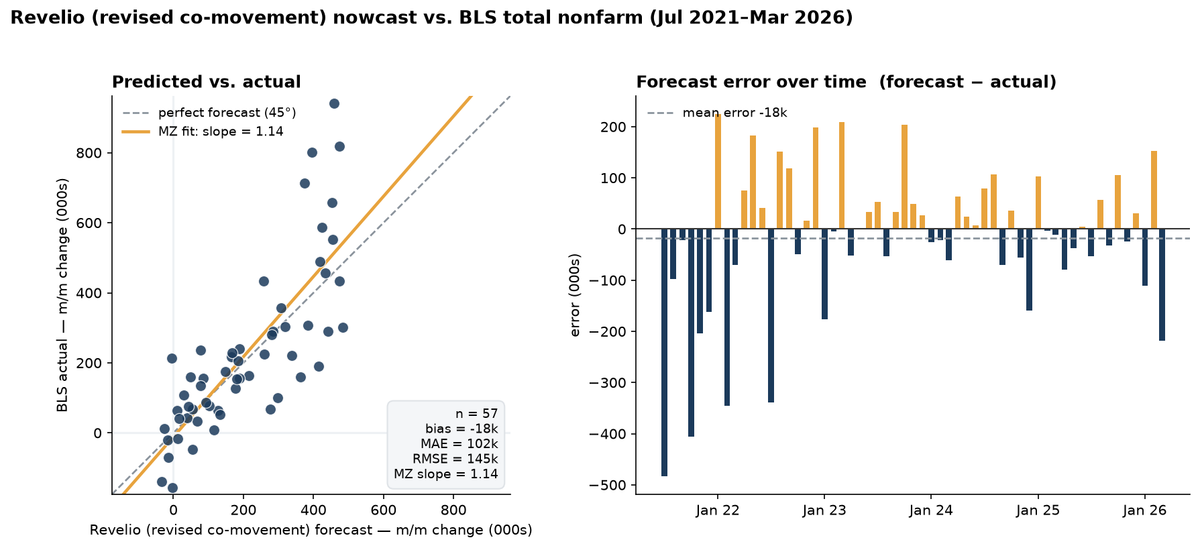
The longer revised-data history tells a different story. Over 57 months, the revised RPLS and revised BLS series produce a Mincer–Zarnowitz slope of 1.14 — close to one — even though the average miss is larger (MAE 102k). But that is a tracking exercise, not a real-time forecast test: it scores Revelio’s latest history against revised BLS, not first releases against first prints. So it cannot overturn the eleven-month result. What it does is weigh against treating overreaction as an established feature of RPLS — the low real-time slope is not visible in the longer revised-data relationship. The plainer reading of the eleven-month number is the simplest one: a short history plus one enormous miss reshapes every calibration statistic.

The real test: Revelio versus LinkedIn
Beating mechanical rules is the easy part. The harder question is whether Revelio beats another sophisticated real-time read. LinkedIn Economic Graph publishes its own payroll estimates from hiring, separation and platform activity. On the ten months where both publish a total-nonfarm figure, the two are close: Revelio has the lower average error, LinkedIn the lower RMSE.
| Metric | Revelio | |
|---|---|---|
| MAE | 79 | 83 |
| RMSE | 95 | 92 |
| Direction | 8 of 10 | 7 of 10 |
The 2025 federal shutdown muddies even that. The BLS calendar slipped from September through November, and LinkedIn explicitly stripped temporary shutdown swings out of its October and November numbers. Strip those three months and the common sample falls to seven clean months. The tiny MAE lead flips — LinkedIn 78.9k, Revelio 80.1k — and LinkedIn keeps the RMSE edge (89.0k vs 101.8k), still weighed down by Revelio’s June miss. Revelio, for its part, calls direction better on the clean cut (5 of 7 vs 4 of 7). The ranking depends on which months you keep, and the MAE gap is about a thousand jobs either way.
That is what a tie looks like in a small sample. Revelio’s June miss hands LinkedIn the RMSE; the clean-sample cut hands LinkedIn the MAE by a hair; the fuller sample and the direction score lean Revelio. The evidence does not support saying either read clearly dominates.
Why ADP and LinkUp sit in different boxes
ADP is useful, but it is a different exercise. The modern ADP National Employment Report is an independent measure of private-sector employment, and ADP says plainly it is not meant to forecast the BLS jobs report. Scored against the BLS first print for private payrolls, ADP’s eleven-month MAE is about 68,000 jobs and its RMSE about 90,000. Informative numbers — but they should not sit next to Revelio’s 86,000 on total nonfarm, because the two target different series.
LinkUp is a different problem. Its public NFP archive mixes target vintages: some estimates aim at the final revised payroll number, some state no vintage at all, and its September 2025 figure was explicitly hypothetical — what the BLS “would have” printed had the normal release happened. After separating those, exactly one clean first-print month overlaps this window. One month is not a track record. LinkUp reads better as a leading signal of labor demand than as a single-number substitute for the print.
How to use the early reads
The temptation is to crown a winner. The more useful move is to treat the early numbers as a portfolio of signals. Revelio has earned a place because it beat the mechanical guesses over its first eleven public releases. LinkedIn matches it on the clean sample. ADP gives an independent read on private payrolls. Vacancy data like LinkUp is a leading signal of labor demand, not a substitute for the headline.
Don’t average them blindly. Know what each one measures, which vintage it targets, and where its information comes from. When independent indicators point the same way, confidence should rise. When they disagree, the disagreement is information too.
The bottom line
The race to predict payrolls has no clear champion yet. Revelio passed the first test — over its brief public history it produced smaller average errors than simple rules and called the direction in 9 of 11 months, one more than the naive benchmarks. The stronger question — durable forecasting superiority — the data cannot answer yet. Eleven months is too few, and the comparison with LinkedIn is a draw.
That is still worth something. Revelio has earned a place on the dashboard because it beats simple guesses. But the evidence points to combining independent signals rather than crowning one proprietary dataset. RPLS is not a replacement for the jobs report. It is a credible early read — a compass, not a coordinate. The case for watching it is not that it always gets the number right. It is that, so far, it has added information before the official print without pretending to more precision than the evidence allows.
Sources & methodology.
Revelio. The real-time sample uses the published RPLS first-release monthly change from Revelio’s Summary revisions table, August 2025 (its first public edition) through June 2026 — eleven observations. Later RPLS revisions are not substituted for what was originally published. The longer calibration check is a tracking exercise on Revelio’s revised co-movement series against revised BLS back to July 2021 (57 months), not a real-time forecast test.
BLS outcome. Total nonfarm payroll growth is scored against the BLS first print, rebuilt with same-vintage differencing from the ALFRED release history so revised levels from different vintages are never mixed. Errors are in thousands of jobs.
Benchmarks. Revelio is compared with a zero-growth forecast, a prior-month persistence rule, and a trailing three-month mean, all scored on the same eleven months. A rule that mechanically repeats the prior month’s payroll change makes no active acceleration/deceleration call.
LinkedIn. Published LinkedIn Economic Graph estimates are compared only on common months targeting total nonfarm and the BLS first print (ten months). September–November 2025 are dropped for the clean cut because the shutdown disrupted the release calendar and LinkedIn excluded temporary shutdown swings from some estimates.
ADP. The ADP National Employment Report is scored separately against the BLS first print for private payrolls (USPRIV), converted to thousands. It is not ranked against the total-nonfarm nowcasts because it measures a different employment concept.
LinkUp. Public LinkUp estimates are separated by target vintage; final-revision and unspecified-vintage forecasts and the September 2025 hypothetical are excluded from first-print tests, leaving one clean month.
Calibration. Mincer–Zarnowitz results are descriptive diagnostics only. Influence statistics show June 2026 dominates the eleven-month real-time slope (0.32); the 57-month revised-data tracking slope is 1.14.