How And Why Economic Data Moves Mortgage Rates

Key Takeaways
- The bond market is the messenger. Economic reports move mortgage rates by changing what investors expect the Fed to do; on major data days, a 10-basis-point move in the 2-year Treasury comes with roughly a 4- to 7-basis-point move in mortgage rates that same day.
- The report that matters most follows the Fed’s biggest worry. CPI days produced the largest mortgage-rate moves during the 2020–2023 inflation shock, jobs reports took over as attention shifted to the labor market, and PCE days have looked like ordinary days.
- The Fed doesn’t have to act for your rate to move. Markets reprice after every major report, so mortgage rates can change long before the Fed touches its policy rate.
The short answer
Mortgage rates respond to economic data mainly through one channel: what the news changes about the market’s outlook for interest rates.
When an economic report changes expectations for the path of Federal Reserve policy, that repricing shows up especially clearly in the 2-year Treasury yield. Longer-term Treasury yields and mortgage rates adjust alongside it, but only part of the move reaches mortgage rates immediately.
Our analysis finds that on major economic-data days, a 10-basis-point move in the 2-year Treasury is associated with roughly a 4- to 7-basis-point move in mortgage rates that same day.
Not every economic report matters equally. And the report that matters most has changed over time.
During the 2020–2023 inflation shock, CPI days produced the largest mortgage-rate moves. As attention shifted toward the labor market, jobs reports became more important. PCE—the Fed’s preferred inflation gauge—has generally produced smaller mortgage-rate moves.
The broader lesson is simple: the economic report most likely to move mortgage rates is the one most capable of changing the market’s outlook for monetary policy.
How economic news reaches your mortgage rate
The Federal Reserve does not set mortgage rates.
It sets a short-term overnight interest rate. Financial markets determine longer-term rates based partly on where investors expect short-term rates, inflation and economic growth to go in the future.
That is why the 2-year Treasury is useful. It is particularly sensitive to changes in the expected path of monetary policy.
When an economic report changes that outlook, Treasury yields reprice. On major data-release days in our sample, the 10-year Treasury moves about 0.7 basis points for every 1-basis-point move in the 2-year.
Mortgage rates then respond to changes in longer-term Treasury yields and prices in the mortgage-backed securities market.
Think of the transmission mechanism this way:
Economic news → expected path of monetary policy → Treasury yields → mortgage-backed securities → mortgage rates
Our analysis measures how a market reaction to economic data travels through to mortgage rates.
Which economic reports move mortgage rates?
Since 2017, CPI and jobs-report days have produced larger mortgage-rate moves than ordinary trading days. PCE days have not.
| Day type, 2017–2026 | Mortgage-rate move vs. ordinary day | Days |
|---|---|---|
| CPI report | 1.44× | 115 |
| Jobs report | 1.27× | 119 |
| Fed decision | 1.08× | 79 |
| PCE report | 0.91× | 114 |
The differences for CPI and jobs days are statistically significant in the full sample. The difference for PCE days is not.
That PCE result is especially interesting.
PCE is the Fed’s preferred inflation measure, yet across 114 releases since 2017, mortgage rates moved only 0.91 times as much as on an ordinary day.
One likely explanation is timing. PCE arrives after CPI and PPI, and forecasters can use those earlier reports to anticipate much of the PCE release. By the time PCE arrives, some of the information may already be incorporated into market prices.
Our analysis establishes that PCE days have produced mortgage-rate moves no larger than an ordinary day, and smaller than CPI or jobs days. It does not establish that predictability is the cause.

The report that matters changes

The full-sample averages hide something more interesting.
The economic report associated with the biggest mortgage-rate moves has changed as the economic environment has changed.
From 2017 through 2019, no major report consistently stood out.
During the 2020–2023 inflation shock, CPI days produced mortgage-rate moves about 1.6 times as large as an ordinary day.
From 2024 through early 2026, as attention increasingly shifted toward the labor market, jobs-report days produced moves about 1.9 times as large as an ordinary day.
More recently, Fed decision days have produced the largest moves, although the sample is very small—only five meetings in the latest period—so that result should be treated cautiously.
The connection between these changing sensitivities and the Fed’s changing concerns is our interpretation of the evidence, not a formal causal test.
But it points toward a useful way to think about economic releases:
Don’t just ask whether a report is important. Ask whether it contains information capable of changing the expected path of monetary policy.
How much of the market move reaches mortgage rates?
The answer depends somewhat on the report.
On release days since 2017:
| Report | 10-year move per 1 bp move in 2-year | Mortgage-rate move per 1 bp move in 2-year |
|---|---|---|
| CPI | 0.69 bp | 0.69 bp |
| PCE | 0.80 bp | 0.46 bp |
| Jobs | 0.71 bp | 0.44 bp |
So if a jobs report is accompanied by a 10-basis-point increase in the 2-year Treasury, the historical relationship implies roughly a 4.4-basis-point same-day increase in mortgage rates.
For CPI, the estimated same-day pass-through is larger: roughly 6.9 basis points for a 10-basis-point move in the 2-year.
These are historical associations, not structural causal estimates. Daily close-to-close movements can incorporate other news that arrives during the same trading day.
But the pattern is clear: mortgage rates typically absorb only part of a Treasury-market repricing immediately.
Economic news can also change the shape of the yield curve
The 10-year does not necessarily move one-for-one with the 2-year.
Jobs days provide a particularly clear example. Our estimated response of the 10-year relative to the 2-year is about 0.71. That means when the 2-year rises, the 10-year has historically tended to rise by less.
The result is a flatter yield curve.
For jobs-report days, our estimated response of the 2-year/10-year slope is −0.29, with a t-statistic of −8.3.
In other words, when economic news produces a large upward repricing in the front end of the Treasury market, longer-term yields generally rise by less.
That is consistent with a market in which economic news changes the expected path of monetary policy without producing an identical change in rates across every maturity.
Do mortgage rates rise faster than they fall?
Usually, no.
For jobs and PCE reports, we do not find strong evidence that mortgage rates systematically respond more to upward moves in Treasury yields than to downward moves.
CPI is the exception in the full sample.
Over 2017–2026 as a whole, when the 2-year fell on CPI days, mortgage rates moved about 0.94 basis points for every 1-basis-point decline. When the 2-year rose, the estimated pass-through was about 0.49.
That difference is statistically significant and survives removing the three largest CPI-day moves, all of which occurred in 2022.
But the asymmetry does not appear in the 2024–2026 data on their own. In that more recent period, the estimated pass-through is 0.69 when the 2-year rises and 0.59 when it falls, and the difference is not statistically significant.
That suggests the full-sample asymmetry largely reflects the unusual inflation-shock period rather than a permanent feature of mortgage pricing.
The mortgage spread matters—and it is a market price
Mortgage rates do not simply equal the 10-year Treasury yield.
The difference between them—the mortgage–Treasury spread—reflects risks that are specific to mortgages.
The biggest is prepayment risk. A 30-year mortgage may be scheduled to pay interest for decades, but the homeowner can repay the loan early—most commonly by refinancing when interest rates fall.
That creates a risk for mortgage investors. Suppose an investor owns a mortgage paying 7% and market rates fall to 5%. The homeowner now has a strong incentive to refinance. The investor gets the principal back but gives up the opportunity to keep collecting that higher interest rate over the remaining life of the mortgage. And because market rates have fallen, that money can now only be reinvested at a lower return.
The reverse happens when rates rise. Homeowners are less likely to refinance, so investors can be left holding lower-yielding mortgages for longer.
That means mortgage investors face an unusual risk: when their high-rate mortgages become most valuable, borrowers are more likely to repay them; when their low-rate mortgages become less attractive, borrowers are more likely to keep them.
Greater interest-rate volatility makes both outcomes harder to predict and increases the value of the homeowner’s refinancing option. Investors demand compensation for taking that risk, which contributes to a wider mortgage–Treasury spread.
The shape of the yield curve matters too.
When the yield curve inverts, markets expect rates to fall. Homeowners are therefore expected to refinance sooner, shortening the expected duration of mortgages.
Mortgages then behave more like shorter-term bonds. And when the yield curve is inverted, shorter-term Treasury yields sit above the 10-year yield. That pushes the mortgage rate higher relative to the 10-year Treasury and widens the mortgage–Treasury spread.
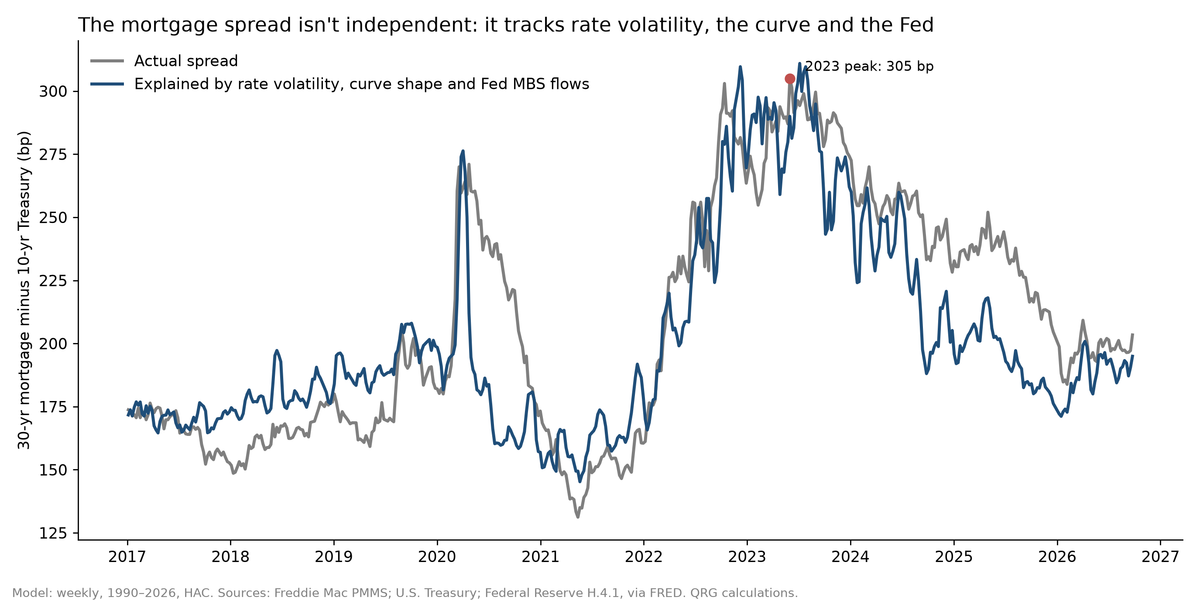
Our model estimated with data going back to 1990 finds that rate volatility and the shape of the yield curve explain a substantial share of variation in the mortgage–Treasury spread.
Each 10-basis-point increase in realized interest-rate volatility is associated with roughly a 6-basis-point wider mortgage spread.
And over longer periods, each additional 10 basis points of yield-curve inversion is associated with roughly a 9-basis-point wider spread.
The distinction matters. The volatility relationship also appears when we examine 13-week changes, while the inversion effect is primarily a relationship in levels. That makes the inversion estimate more useful for understanding longer-running differences in mortgage spreads than week-to-week movements.
This also helps explain why mortgage rates do not always move one-for-one with the 10-year Treasury.
Day to day, only about 55% of a 10-year Treasury move reaches mortgage rates on the same day, with roughly two-thirds showing up within two days.
So when Treasury yields jump rapidly, the mortgage spread can temporarily narrow. When Treasury yields fall rapidly, it can temporarily widen as mortgage rates catch up.
What this means for borrowers

The practical value of these estimates is that we can use the bond market’s reaction to an economic report to quantify the expected move in mortgage rates.
Take a jobs report. Our estimates show that for every 10-basis-point move in the 2-year Treasury yield, mortgage rates have historically moved about 4.4 basis points in the same direction that day.
So if a jobs report sends the 2-year Treasury yield up 20 basis points, the historical relationship implies roughly a 9-basis-point increase in mortgage rates. If the 2-year falls 20 basis points, the same relationship points to roughly a 9-basis-point decline.
CPI is even more interesting because the historical relationship has been asymmetric. Over the full 2017–2026 sample, a 10-basis-point increase in the 2-year Treasury on a CPI day is associated with about a 5-basis-point increase in mortgage rates. But a 10-basis-point decline in the 2-year is associated with about a 9-basis-point decline in mortgage rates.
That asymmetry does not appear in the 2024–2026 data on their own, so it should not be treated as a permanent rule. But it illustrates the broader point: once we observe how the Treasury market interprets an economic report, we can estimate how much of that repricing is likely to reach mortgage rates.
For most individual releases, the resulting mortgage-rate move is modest. A typical jobs-day market reaction translates into roughly a 5-basis-point change in mortgage rates, while an unusually large move can produce something closer to 10 basis points.
Near a 7% mortgage rate, a 5- to 10-basis-point change translates into roughly 0.5% to 1% of homebuying power for a borrower trying to keep the same monthly principal-and-interest payment.
But the bigger lesson is about how mortgage rates are actually determined.
The Fed does not need to change its policy rate for your mortgage rate to change.
Markets continuously update their expectations for the Fed, inflation and the economy. Economic data can change those expectations immediately—and Treasury yields and mortgage rates can move long before the Fed itself does anything.
So after an economic report, don’t just ask whether the headline number was hot or cold.
Watch what the bond market does with it. That market reaction gives us a way to estimate how much of that repricing is likely to reach mortgage rates.
Methods and sources
The daily analysis covers January 2017 through September 2026. Mortgage rates are Optimal Blue daily 30-year conforming lock rates. An ordinary day is a trading day not classified as a jobs, CPI or PCE release day or a Federal Reserve decision day.
Release-day comparisons use mean absolute daily rate changes and Welch tests against ordinary trading days. Pass-through estimates regress the daily change in Treasury yields or mortgage rates on the daily change in the 2-year Treasury yield for each type of economic release.
Because these are daily close-to-close observations, the estimates measure contemporaneous market relationships rather than the precise intraday sequencing of Treasury and mortgage-market reactions.
Six days in the sample contain overlapping release classifications; the analysis assigns priority in the following order: Federal Reserve decision, jobs report, CPI and PCE.
The longer-run mortgage-spread analysis uses weekly data from 1990 through 2026. The model relates the Freddie Mac mortgage–10-year Treasury spread to realized 10-year Treasury volatility, the 10-year minus 2-year Treasury slope, an additional term capturing yield-curve inversion, and the Federal Reserve’s 52-week change in mortgage-backed-security holdings. The regressions use standard errors robust to autocorrelation. The Fed MBS-holdings variable is included as a control but is not statistically significant in the model.
A separate specification using 13-week changes is used as a robustness check on the direction of the relationships. The volatility result persists in that specification, while the inversion relationship appears primarily in the levels model.
This analysis measures the transmission of market reactions to economic releases, not conventional forecast surprises. Measuring a true economic surprise requires comparing the first-reported economic data with the market consensus immediately before the release.
Data: U.S. Treasury yields, Freddie Mac Primary Mortgage Market Survey, Optimal Blue lock rates, and Federal Reserve H.4.1 MBS holdings, via FRED (Federal Reserve Bank of St. Louis); release dates from the FRED release calendar; Federal Reserve decision dates from the Federal Reserve’s meeting calendars.
Mortgage-spread mechanism: Gordon, G. (2023), “Mortgage Spreads and the Yield Curve,” Federal Reserve Bank of Richmond, Economic Brief 23-27; Boyarchenko, N., A. Fuster and D. Lucca, “Understanding Mortgage Spreads,” Federal Reserve Bank of New York, Staff Report 674.
Economic-release literature: Andersen, T., T. Bollerslev, F. Diebold and C. Vega (2003), “Micro Effects of Macro Announcements,” American Economic Review; Gürkaynak, R., B. Sack and E. Swanson (2005), “The Sensitivity of Long-Term Interest Rates to Economic News,” American Economic Review.