A Median-Income Household Would Need About $159,000 In Cash to Afford the Typical U.S. Home

The down payment is only part of the cash hurdle. Even after putting enough down to make the monthly payment affordable, a buyer must still cover closing costs and prepaids.
Key Takeaways
- The down payment is the first hurdle. A median-income household needs about $159,000 in cash to buy the typical U.S. home: a 39% down payment to make the monthly payment affordable, plus closing costs and prepaids. A seller contribution cuts that only to about $144,000.
- Five large metros need far more cash. Among the 50 largest metros, the cash to close is highest in San Jose ($1.21 million), San Francisco ($869,000), Los Angeles ($794,000), San Diego ($720,000) and New York ($599,000).
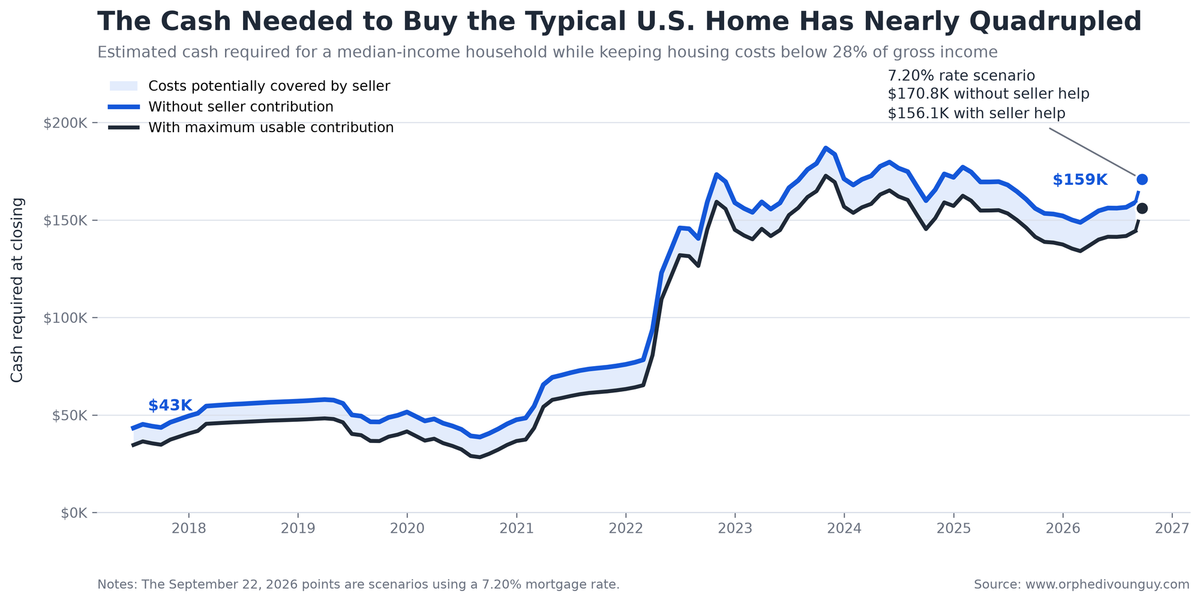
- Higher prices and rates have tripled the hurdle. The national cash requirement rose from about $43,000 in June 2017 to $159,000 in August 2026, and a 7.2% mortgage rate would add nearly $12,000 more.
Under the assumptions used in this analysis, a median-income U.S. household would need approximately $159,000 in cash at closing to purchase the typical home while keeping estimated monthly housing costs below 28% of gross income.
A seller contribution can reduce that requirement, but only to about $144,000.
The reason is simple: The monthly cost of owning a home depends on how large of a down payment the buyer can afford. A larger down payment reduces the mortgage balance and therefore the monthly payment.
But even if a household has enough income and the necessary down payment to afford the home, it still needs enough cash to cover closing costs and prepaids.
That distinction is often missing from discussions about housing affordability.

The typical household needs a 39% down payment
The typical U.S. home was worth approximately $368,700 in August 2026, according to Zillow.
The estimated median household income was approximately $87,700, which supports a total monthly housing payment of about $2,046 if housing costs are limited to 28% of gross income.
At August’s average mortgage rate of 6.67%, a 5%, 10%, or even 20% down payment would leave the household with a monthly payment above that limit.
The household needs to put down approximately $144,300, or 39.1% of the home’s value, to make the monthly payment affordable.
That is the first cash hurdle.
The buyer then needs another:
- $11,100 for estimated closing costs
- $3,700 for prepaids
Add those costs to the required down payment, and the household needs approximately $159,000 in total cash at closing.
A seller contribution can cover closing costs, but not the down payment
Under the conventional-loan assumptions used in this analysis, a buyer making a down payment of at least 25% can receive a seller contribution of up to 9% of the home’s value.
On the typical U.S. home, that produces a theoretical policy limit of approximately $33,200. Conventional financing-concession limits are calculated against the lower of the sales price or appraised value. This analysis assumes the home appraises for at least the purchase price.
But the buyer cannot necessarily use the entire amount.
Seller contributions are generally limited to eligible costs. They cannot be used to satisfy the buyer’s required down payment. In this model, eligible closing costs and prepaids total approximately $14,700.
That means the maximum usable seller contribution is $14,700, even though the policy ceiling is substantially higher.
With the seller covering those costs, the buyer’s cash requirement falls from approximately $159,000 to $144,000—the amount of the required down payment.
The seller credit solves the closing-cost problem. It does not solve the monthly-payment problem.
Affording the payment and closing the transaction are different tests
There are two separate questions a prospective buyer must answer.
First, how much does my down payment have to be so that the monthly payment is affordable?
Second, after making that down payment, do I have enough additional cash to close the transaction?
The first question is determined by the relationship between home prices, mortgage rates, income and recurring ownership costs.
The second depends on closing costs, prepaids and the availability of seller assistance.
A household can pass the monthly-payment test and still fail the cash-to-close test. That is why focusing only on the required down payment understates the financial barrier to homeownership.
In expensive markets, closing costs are not the main problem
Seller assistance has a much smaller effect in the country’s most expensive markets because the required down payment is already enormous.
In San Jose, the typical home is worth approximately $1.53 million, while the median household earns about $177,100 a year. At that income, the household can afford a total monthly housing payment of roughly $4,130 under the 28% limit used in this analysis.
To bring the payment below that threshold, the household must put down approximately $1.15 million, or 75% of the home’s value.
Total cash needed is approximately:
- $1.21 million without a seller contribution
- $1.15 million with the maximum usable contribution
The seller contribution covers approximately $61,000 in estimated transaction costs. But it cannot overcome the gap between the home’s price and the amount the median-income household can afford to finance.
The same basic problem appears in San Francisco, Los Angeles, San Diego and other expensive coastal markets. Seller assistance lowers the amount needed at closing, but the required down payment remains far beyond the reach of most median-income households.
The national cash requirement has more than tripled since 2017
In June 2017, the median-income U.S. household needed approximately:
- $43,300 without a seller contribution
- $34,600 with the maximum usable contribution
The typical home was worth about $218,100, the average mortgage rate was 3.90%, and the required down payment was approximately 15.9%.
By August 2026, the typical home value had risen to about $368,700 and the mortgage rate had climbed to 6.67%. The required down-payment share reached 39.1%.
As a result, total cash needed without seller assistance rose from approximately $43,000 to $159,000.
The cash requirement was even higher in October 2023, when the monthly average mortgage rate reached 7.62%. At that point, the median-income household needed approximately $187,000 without seller assistance.
The subsequent decline in mortgage rates and continued income growth have helped, but they have not restored affordability.
A 7.2% mortgage rate scenario adds nearly $12,000 to the cash requirement
Applying the 7.20% mortgage rate observed on September 22, 2026 in the Mortgage News Daily index, while holding home values, estimated income and non-mortgage housing costs at their August levels increases the required down payment from 39.1% to 42.3%.
Under that scenario, the national cash requirement increases to:
- $170,800 without a seller contribution, from $159,000
- $156,100 with the maximum usable contribution, from $144,300
That is an increase of approximately $11,800.
Higher rates raise the cost of every dollar borrowed. To remain below the same monthly-payment limit, the household must borrow less and bring more cash to closing.
The central affordability problem is the amount households must finance
Seller contributions can be valuable. They can help a household that has the income and required down payment but lacks enough additional cash to cover closing costs.
But seller credits cannot make the monthly payment affordable.
For most markets, the larger problem is the gap between the typical home’s price and the loan balance a median-income household can support.
Closing-cost assistance can help a buyer complete an otherwise affordable transaction. It cannot substitute for lower home prices, lower mortgage rates, higher incomes or a much larger down payment.
For a median-income household without substantial savings, the typical U.S. home remains out of reach—and the cash hurdle is considerably larger in many expensive metropolitan markets.
| Metro area | Typical home value | Required down payment | Usable seller credit | Cash to close, no seller credit | Cash to close, with seller credit |
|---|---|---|---|---|---|
| United States | $368,697 | $144,297 | $14,748 | $159,045 | $144,297 |
| New York, NY | $735,075 | $569,385 | $29,403 | $598,788 | $569,385 |
| Los Angeles, CA | $952,601 | $756,028 | $38,104 | $794,132 | $756,028 |
| Chicago, IL | $357,265 | $120,870 | $14,291 | $135,161 | $120,870 |
| Dallas, TX | $360,437 | $127,089 | $14,417 | $141,507 | $127,089 |
| Houston, TX | $305,001 | $88,972 | $12,200 | $101,172 | $88,972 |
| Washington, DC | $573,336 | $218,679 | $22,933 | $241,613 | $218,679 |
| Philadelphia, PA | $389,524 | $157,199 | $15,581 | $172,780 | $157,199 |
| Miami, FL | $475,830 | $330,143 | $19,033 | $349,176 | $330,143 |
| Atlanta, GA | $377,428 | $119,077 | $15,097 | $134,174 | $119,077 |
| Boston, MA | $733,574 | $446,203 | $29,343 | $475,546 | $446,203 |
| Phoenix, AZ | $442,078 | $162,972 | $17,683 | $180,655 | $162,972 |
| San Francisco, CA | $1,123,193 | $824,381 | $44,928 | $869,309 | $824,381 |
| Riverside, CA | $581,454 | $355,351 | $23,258 | $378,609 | $355,351 |
| Detroit, MI | $267,167 | $53,433 | $10,687 | $64,120 | $53,433 |
| Seattle, WA | $727,359 | $449,773 | $29,094 | $478,867 | $449,773 |
| Minneapolis, MN | $388,865 | $125,831 | $15,555 | $141,386 | $125,831 |
| San Diego, CA | $930,785 | $683,058 | $37,231 | $720,290 | $683,058 |
| Tampa, FL | $358,706 | $170,985 | $14,348 | $185,333 | $170,985 |
| Denver, CO | $559,705 | $257,553 | $22,388 | $279,941 | $257,553 |
| Baltimore, MD | $400,263 | $119,588 | $16,010 | $135,598 | $119,588 |
| St. Louis, MO | $275,704 | $55,141 | $11,028 | $66,169 | $55,141 |
| Orlando, FL | $383,445 | $184,054 | $15,338 | $199,392 | $184,054 |
| Charlotte, NC | $384,458 | $130,580 | $15,378 | $145,959 | $130,580 |
| San Antonio, TX | $276,747 | $67,432 | $11,070 | $78,502 | $67,432 |
| Portland, OR | $542,843 | $282,604 | $21,714 | $304,317 | $282,604 |
| Sacramento, CA | $574,820 | $317,648 | $22,993 | $340,641 | $317,648 |
| Pittsburgh, PA | $232,122 | $32,721 | $9,285 | $42,006 | $32,721 |
| Cincinnati, OH | $308,426 | $77,514 | $12,337 | $89,851 | $77,514 |
| Austin, TX | $417,977 | $175,125 | $16,719 | $191,844 | $175,125 |
| Las Vegas, NV | $423,983 | $183,522 | $16,959 | $200,482 | $183,522 |
| Kansas City, MO | $327,320 | $103,185 | $13,093 | $116,278 | $103,185 |
| Columbus, OH | $330,327 | $100,088 | $13,213 | $113,301 | $100,088 |
| Indianapolis, IN | $293,506 | $60,022 | $11,740 | $71,762 | $60,022 |
| Cleveland, OH | $253,678 | $57,824 | $10,147 | $67,971 | $57,824 |
| San Jose, CA | $1,527,731 | $1,150,934 | $61,109 | $1,212,043 | $1,150,934 |
| Nashville, TN | $452,186 | $195,163 | $18,087 | $213,250 | $195,163 |
| Virginia Beach, VA | $373,040 | $149,278 | $14,922 | $164,200 | $149,278 |
| Providence, RI | $525,363 | $335,852 | $21,015 | $356,866 | $335,852 |
| Jacksonville, FL | $350,783 | $137,714 | $14,031 | $151,745 | $137,714 |
| Milwaukee, WI | $388,845 | $214,473 | $15,554 | $230,027 | $214,473 |
| Oklahoma City, OK | $245,317 | $50,504 | $9,813 | $60,317 | $50,504 |
| Raleigh, NC | $431,269 | $132,563 | $17,251 | $149,814 | $132,563 |
| Memphis, TN | $244,737 | $58,156 | $9,789 | $67,945 | $58,156 |
| Richmond, VA | $394,521 | $158,714 | $15,781 | $174,495 | $158,714 |
| Louisville, KY | $280,129 | $65,910 | $11,205 | $77,116 | $65,910 |
| New Orleans, LA | $261,002 | $129,375 | $10,440 | $139,815 | $129,375 |
| Salt Lake City, UT | $560,068 | $264,236 | $22,403 | $286,638 | $264,236 |
| Hartford, CT | $402,457 | $179,467 | $16,098 | $195,565 | $179,467 |
| Buffalo, NY | $291,683 | $66,547 | $11,667 | $78,214 | $66,547 |
| Birmingham, AL | $262,563 | $52,512 | $10,502 | $63,015 | $52,512 |
Methodology
The analysis covers the United States and the 150 largest income-matched metropolitan areas from June 2017 through August 2026.
Home values are measured using Zillow’s Home Value Index. Median household income comes from the U.S. Census Bureau’s American Community Survey (ACS). Income after June 2024—the latest available year in the ACS—is estimated. ACS income observations are assigned to June of each survey year and interpolated between annual observations. After June 2024, income is nowcast using growth in the Employment Cost Index for wages and salaries of all civilian workers. The July and August 2026 estimates extrapolate the monthly growth rate implied by the latest available ECI quarter.
The affordable monthly housing payment is limited to 28% of gross median household income. The 28% threshold is a standardized front-end affordability benchmark, not a prediction of mortgage approval. Actual underwriting also considers other debts, credit characteristics, available assets and program-specific requirements.
The estimated payment includes mortgage principal and interest, private mortgage insurance when the down payment is below 20%, property taxes, homeowners insurance and maintenance costs. Historical mortgage rates are calculated as the monthly average of Freddie Mac’s weekly 30-year fixed mortgage rate. The September scenario applies the 7.20% rate from Mortgage News Daily’s daily 30-year fixed index on September 22 to August 2026 home values, estimated income and non-mortgage housing costs.
The required down payment is the minimum amount necessary to bring the modeled total monthly payment within the 28% affordability limit.
Buyer cash at closing includes the required down payment, closing costs modeled at 3% of the home value and prepaids modeled at 1%.
Seller-contribution limits follow conventional principal-residence financing caps. The usable contribution is limited to the lesser of the policy cap or estimated closing costs and prepaids and cannot reduce the required down payment.
Actual loan terms, underwriting standards, taxes, insurance costs, closing expenses and seller-credit eligibility will vary by household and property.