July-August 2026 Housing Market Report: Luxury Buyers Stay Active. The Rest of the Housing Market Is Under Stress.

Mortgage rates are back near 7%, buyers are pulling back and inventory is rebuilding. But the top of the market has been moving in the other direction.
Key Takeaways
- The story of the summer is the resilience of the luxury segment. Over the three months ending in July, our model-implied luxury buyer pool was up 3.6% from a year ago while active luxury inventory fell 2.2%. Together, that pushed the number of listings per active buyer down about 5.5%. Luxury prices rose 5.3% — more than twice the pace in the middle of the market. Luxury homes are defined as those in the top 5% of sale prices within each local market.
- Buyers have more leverage almost everywhere else. In August, the latest all-homes data show the buyer pool down about 2% from a year ago while active inventory was up 2.7%. The number of listings per active buyer rose about 4.8%, giving buyers who can still afford to transact more choice, especially across the Sun Belt.
- For sellers, pricing power is concentrating. The luxury end of the market and supply-constrained Northeast and Midwest markets still have support. In inventory-heavy markets, sellers increasingly have to compete on price. The broad market is getting easier for buyers who can afford to transact. The top end is getting more competitive.
- Total transaction value — a useful proxy for the size of the industry’s commission pool — declined from July but remains above year-ago levels. Transaction-value momentum is strengthening in markets like Buffalo, Hartford, Providence, Cleveland, Pittsburgh and New York, while weakening in markets like San Jose, Denver, Seattle and Salt Lake City.
The macroeconomic backdrop
Three forces are pulling housing in different directions.
First, mortgage rates have taken back much of the relief buyers got earlier this year. Freddie Mac’s 30-year fixed rate averaged 6.76% last week, up from about 6% in February and above 6.35% a year ago. Mortgage News Daily’s more current measure reached 7.17% in September.
Second, the labor market is limiting residential mobility. This year, hires and quits stayed at their lowest levels in over a decade outside the pandemic disruption. A lack of new opportunities is keeping people in place. Workers are not changing jobs very often, and job changes are one reason households move. At the same time, wage growth is slowing and wages adjusted for inflation have fallen. Less churn and falling real wages mean fewer relocations, fewer people entering the housing market and fewer housing transactions.
The third force is different: wealth at the top has held up. The S&P 500 is about 16% above its level a year ago and remains near record highs. The AI investment boom has disproportionately benefited stock market participants, the same households most able to buy expensive homes without being as constrained by mortgage rates. That does not prove stocks caused the improvement in luxury housing, but it gives high-income and high-wealth buyers a larger cushion. An increase in financial wealth is associated with an increase in housing market activity.
Housing is under stress. Luxury market stays resilient
The seasonal data sharpen the story. Higher mortgage rates are weighing on the broad market, but the pressure is not uniform.
Pending sales: higher rates are hitting the broad market harder
Mortgage rates are now above year-ago levels, and the broad housing market is feeling it. Pending sales weakened in July and remained soft in August, consistent with buyers pulling back as financing costs moved higher.

Luxury has held up better. Pending luxury sales eased from their June peak, as they normally do after the spring selling season, but remained comfortably above year-ago levels in July. That is consistent with a market whose buyers are less rate-sensitive and have benefited more from rising financial wealth.
The buyer pool: luxury demand is proving more resilient
Our model translates pending sales and active inventory into an estimate of the active buyer pool.

The all-homes buyer pool peaked in the spring and weakened again in July and August. The luxury housing market followed the normal seasonal pattern too, peaking around June before easing in July, but remained above 2025. The point is not that luxury has escaped the slowdown. It is proving more resilient to it.
For an apples-to-apples comparison, here is what happened over the three months ending in July:
| Market (3-mon rolling average) | Active inventory, y/y | Estimated buyer pool, y/y | Listings per buyer, y/y |
|---|---|---|---|
| Luxury | −2.2% | +3.6% | −5.5% |
| All homes | −0.2% | +2.3% | −2.5% |
Through July, buyer demand remained higher than in the early summer of 2025. But luxury tightened more because the buyer pool stayed elevated relative to the number of homes coming on the for-sale market. With more buyers than sellers coming on the market, active inventory remained below year-ago levels.
In the broader market, inventory was essentially flat as the buyer pool increased. This is because home sales roughly matched the flow of homes coming on the market.
Then the broad market turned as mortgage rates moved higher into August. Our model-implied buyer pool is now down 2% from a year earlier, pending sales are 1.3% lower, and active inventory is 2.7% higher. Fewer buyers is pushing housing inventory higher and shifting bargaining power toward those who can still afford to transact.
Inventory: the balance between buyers and sellers is diverging
In the luxury market, a larger buyer pool is competing for a smaller stock of active listings than a year ago. Demand has held up better and available supply is lower.

As of August 2026, the slowdown in the flow of buyers relative to sellers in the broader market is pushing inventory higher. In August, active inventory kept rising and stood 2.7% above a year ago. This is because buyers retreated, leaving more homes available for each buyer that can still afford to transact in this housing market.
We are also heading into the slower fall and winter selling season, when inventory typically begins to decline. Even if broad-market inventory now falls seasonally, the market could enter fall with more homes available relative to buyers than it had a year ago.
Total listings per buyer show where bargaining power sits
Demand alone does not determine leverage. What matters is how many listings are available for each potential buyer.
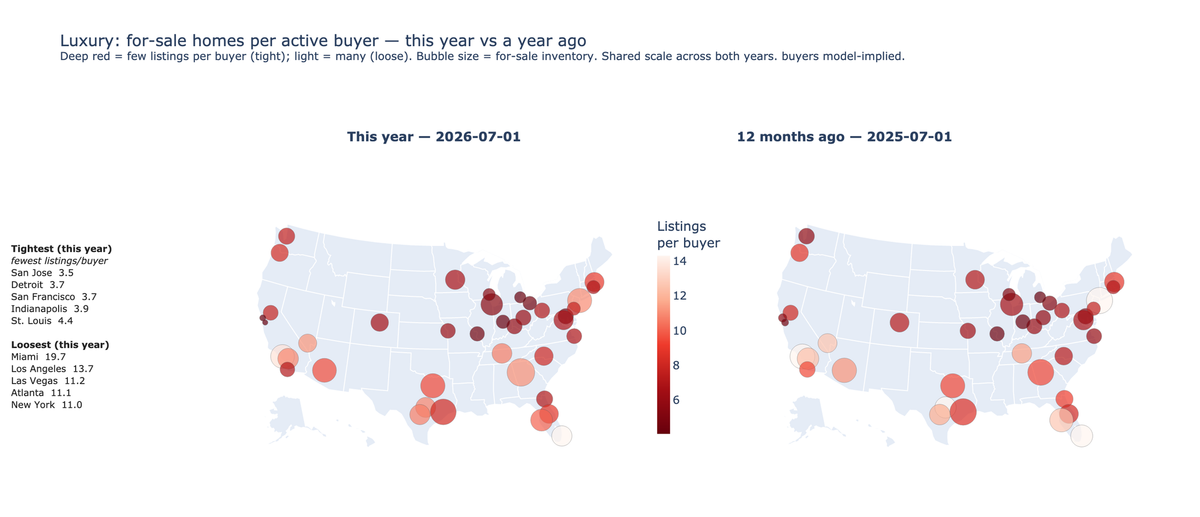
Luxury remains the loosest tier in level terms. It has about 8.6 listings per potential buyer and roughly 6.1 months of supply, compared with around 5 listings per buyer and 3.9 months of supply in the middle of the market. Homes in the luxury market typically take longer to sell than non-luxury homes. This is why listings per buyer and months of supply are typically higher than for the rest of the market.
But the momentum is shifting.
As of July, luxury listings per buyer were 5.5% lower than a year ago. That was not simply because more buyers entered the market. The luxury buyer pool rose faster than the pool of active luxury listings could refill. As a result, bargaining power has shifted toward luxury home sellers.

The broader market is moving the other way. Buyers have pulled back and the pool of homes for sale has increased.

Where listings pile up relative to buyers, sellers have less pricing power. Where they remain scarce, prices have more support. Hartford, San Francisco, Kansas City, Richmond and Cleveland remain among the tightest large markets. Miami, Nashville, Houston, Austin and Atlanta give buyers considerably more choice.
What this means for buyers
In Miami, Houston, Austin, Atlanta and other supply-heavy markets, buyers have room to negotiate. Price reductions, closing-cost help and other concessions matter more when sellers are competing for fewer buyers. The opportunity today is not necessarily a lower mortgage rate. It is using weak local market conditions to negotiate a better purchase price.
Luxury buyers still have more to choose from, but the window is narrowing. There are more potential buyers and fewer homes available than a year ago, and the strongest luxury markets are becoming more competitive.
What this means for sellers
Sellers need to know which market they are in.
In tight Northeast and Midwest markets, and in portions of the luxury market, inventory remains constrained enough to support pricing. In much of the Sun Belt, it does not.
More listings per buyer means buyers can walk away. Sellers who price based on outdated market conditions risk seeing their home sit longer on the market as newer, better-priced listings compete for a smaller pool of buyers. Price based on today’s competition, not yesterday’s comparable sale.
For buyers on the fence: waiting has a cost
Rates make the decision harder, but waiting has not made the typical home cheaper to finance.
Using the February average mortgage rate and median home price in the analysis, versus today’s 7.17% rate and the latest price, the principal-and-interest payment on the typical U.S. home is about $326 per month higher — roughly $3,900 per year. The required 20% down payment is also about $3,700 higher. The increase in the typical monthly mortgage payment is smaller for starter homes, about $174 per month, and much larger in luxury, about $591.
That does not mean every buyer should rush. It means buyers should not assume waiting automatically improves affordability or their options. In a loose market, the better strategy may be to use today’s bargaining power to negotiate the price rather than wait for a mortgage rate decline that may or may not arrive.
What this means for housing professionals
For agents, brokers and other housing professionals, the question is not just whether prices or sales are rising. It is how many housing dollars are changing hands.
Total transaction value — the average sale price multiplied by homes sold — remains above year-ago levels. Our latest August indicator declined from July. The broader evidence still points to a national transaction pool that is larger than it was a year ago.
Transaction value is a useful proxy for the size of the industry’s commission pool. Despite weak sales volumes, higher home values have kept the total pool of housing dollars changing hands above last year’s level.
Our latest August market indicator shows transaction-value momentum strengthening in markets like Buffalo, Hartford, Providence, Cleveland, Pittsburgh and New York, while weakening in markets like San Jose, Denver, Seattle and Salt Lake City. Across the 50 largest metros, 28 are gaining momentum and 22 are losing it.
There is no single national housing market. The commission pool remains larger than a year ago, but where that opportunity sits is changing.