Resilient, but Narrow

Private demand is strong, unemployment is low and consumers are still spending. And yet hiring has nearly stalled, real incomes have barely grown and an outsized share of GDP growth came from capital investment.
Key Takeaways
- Real GDP grew 1.5% annualized in the second quarter, while private domestic demand rose 4.2%.
- Equipment and intellectual-property investment contributed 1.2 percentage points of that 1.5% growth.
- Consumers are still spending faster than their incomes are growing, while inflation remains above 3%.
The U.S. economy is still growing. But look at what is actually driving that growth and the picture gets more complicated.
Private demand is strong. Consumers are still spending. Businesses are investing heavily. At the same time, hiring is historically weak, real income is barely higher than it was a year ago and the industries most exposed to high interest rates remain under pressure.
The economy is resilient. It is also unusually narrow.
Private demand is stronger than headline GDP
Real GDP grew at a 1.5% annualized rate in the second quarter. Underneath that relatively soft headline, real final sales to private domestic purchasers — consumer spending plus private fixed investment — grew 4.2%.
That is not a weak demand number.
But the composition of GDP growth matters. Equipment and intellectual-property investment contributed 1.20 percentage points to the quarter’s 1.5% growth. Everything else combined contributed about 0.30 point.

Capital investment carried the quarter
Equipment and intellectual-property investment accounted for roughly 80% of second-quarter GDP growth.
That is a broad measure — it includes much more than AI. A narrower estimate that focuses on AI-related technology spending and nets out the related imports puts AI’s contribution closer to a third.
Still, the investment boom is hard to miss.
Data centers need computers, software, electricity and increasingly large amounts of physical infrastructure. The companies supplying that buildout are spending heavily even as more interest-rate-sensitive parts of the economy struggle.
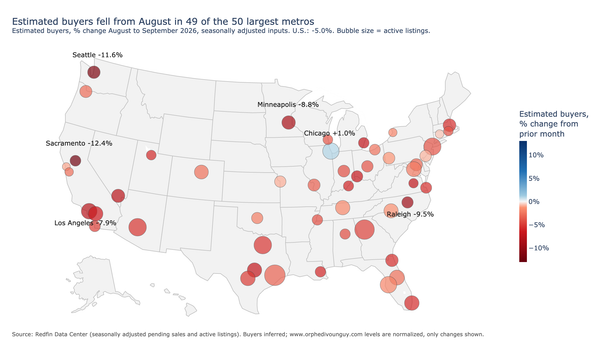
Housing is the clearest example. Homebuilders are having their weakest summer since 2020.
The investment is here. The productivity payoff is harder to find.

The investment boom is here. The payoff isn’t — yet.
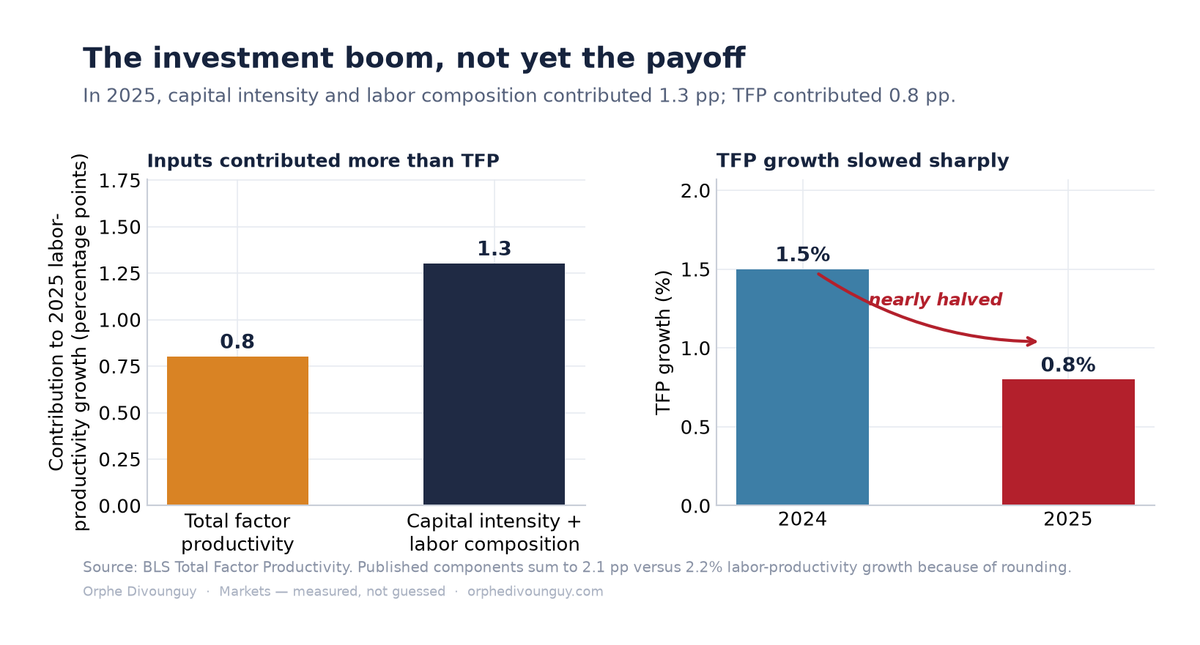
Labor productivity grew 2.2% in 2025. But most of that improvement did not come from faster total factor productivity.
Capital intensity contributed about 0.9 percentage point. Changes in labor composition added another 0.4 point. TFP contributed about 0.8 point.
And TFP growth actually slowed — from roughly 1.5% in 2024 to 0.8% in 2025.
That matters because labor-force growth has slowed sharply. If the economy is going to grow materially faster over the long run, more of that growth will have to come from productivity.
So far, we are seeing companies add a lot of capital. We are not yet seeing a sustained acceleration in how efficiently the economy turns capital and labor into output.
That could change. TFP is noisy and gets revised. New technologies also take time to spread through the economy and change the way businesses operate.
But for now, the productivity boom remains more promise than data.

Consumers are still spending. Income isn’t keeping up.
The consumer has been remarkably resilient.
Real consumer spending was 2.1% higher than a year ago in July. Real disposable income was up just 0.5%.
The saving rate helps explain the difference. It fell from 4.5% a year ago to 3.0%.
Households can keep spending faster than their incomes grow for a while. They can save less, draw on wealth or borrow.
That is much easier for households that already own homes, stocks and other assets. It is harder for younger households and people who rely more heavily on wages and new credit.
The gap cannot widen forever. If income growth does not pick up, consumption eventually has to slow or households have to keep leaning on savings, wealth and credit.

The treadmill, in dollars
Another way to see the pressure is to put inflation into dollars.
Average annual expenditures in the BLS Consumer Expenditure Survey were about $78,535 per consumer unit.
Use that as a benchmark and apply the 3.7% rise in the PCE price index over the past year. Buying an unchanged basket of goods and services would cost roughly $2,906 more per year — about $242 more every month.
That is what 3.7% inflation feels like even when the economy is growing.
Real income can be positive and households can still feel as though they are running in place. More of each paycheck simply goes toward buying the same things.

Inflation still starts with a 3
Headline PCE inflation was 3.7% in July. Core PCE was 3.3%. Services excluding housing and energy were running at 3.9% over the year.
The Fed’s target is 2%.
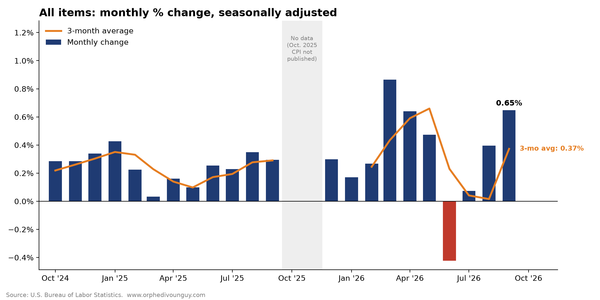
July was not an inflation scare, but it was not especially reassuring either. Core PCE ran at about a 3% annualized pace for the month, up from June’s softer reading. The stickier services categories remain elevated.
My bias is still that inflation comes down. The problem is getting all the way back to 2%.
Energy is one obvious risk.
Oil is particularly troublesome because it works in both directions at once: higher energy prices push inflation up while reducing household purchasing power.
Longer term, AI could help bring inflation down if it produces a lasting productivity gain.
We just do not have much evidence of that yet.

Weak hiring does not mean what it used to
The labor market is another place where the headline can mislead.
Hiring is very weak. But unemployment is still just 4.1%.
The reason is that the economy no longer needs as many new jobs each month to keep unemployment steady.
Federal Reserve Board estimates put breakeven employment growth at roughly 155,000 jobs per month in 2023–24, falling to about 85,000 in 2025. With very weak labor-force growth, the 2026 breakeven rate could be near zero or below 10,000 jobs per month.
That means a payroll gain of 20,000 or 30,000 today does not carry the same meaning it did a few years ago.
This is still a low-hire, low-fire labor market.
For someone who already has a job, conditions remain relatively stable. For someone looking for work — a recent graduate, a laid-off worker or someone trying to switch employers — it feels much weaker.
The thing to watch is layoffs.
Weak hiring by itself can coexist with low unemployment when labor-force growth is slow. Weak hiring plus rising layoffs is a much more dangerous combination.

The bottom line
The economy is not in recession. Private demand is growing at a healthy pace, unemployment is low and consumers are still spending.
But the strength is not evenly distributed.
Capital investment is doing an unusually large amount of the work. Consumers are spending faster than their incomes are growing. Hiring is weak. Inflation is still above 3%.
And that leaves the biggest question unanswered: has the AI investment boom actually raised the economy’s long-run growth potential?
If it has, today’s high real interest rates may eventually look more normal. Faster productivity growth would allow the economy to grow faster without generating as much inflation.
But TFP slowed last year, and estimates of potential growth remain close to 2% — the CBO projects potential GDP growth averaging 2.1% through 2030 and 1.8% thereafter.
For now, I am more inclined to see today’s high real rates as restrictive than as evidence that the economy has already moved to a permanently higher-growth equilibrium.
The risk is that those rates squeeze the broader economy before the investment boom delivers the productivity gains needed to justify them.
That is the tension heading into Jackson Hole: the economy is still growing, but it has less room for error than the headline numbers suggest.
Sources and methods. GDP and contributions from BEA NIPA tables 1.1.1 / 1.1.2 (Q2 2026 second estimate). Income, spending and the saving rate from BEA Personal Income & Outlays and FRED series DSPIC96, PCEC96 and PSAVERT. PCE price measures from FRED (PCEPI, PCEPILFE, services ex-housing and energy). Labor productivity from BLS Productivity and Costs and the annual decomposition from BLS Total Factor Productivity (nonfarm business); TFP is a residual, not a pure efficiency measure. The AI-specific, net-of-imports contribution follows ING. The same-basket figure uses the BLS Consumer Expenditure Survey (2024 average annual expenditures per consumer unit) scaled by the PCE price index — an illustrative benchmark, since the two have different weights. Breakeven employment from the Federal Reserve Board (Murray & Vidangos, 2026), with a wider St. Louis Fed 2026 range (15k–87k). Potential-growth reference from CBO. Figures are point-in-time as of late August 2026 and subject to revision.