Kansas Passed a Law To Speed Up Housing Permit Approval. But, Did It Work?

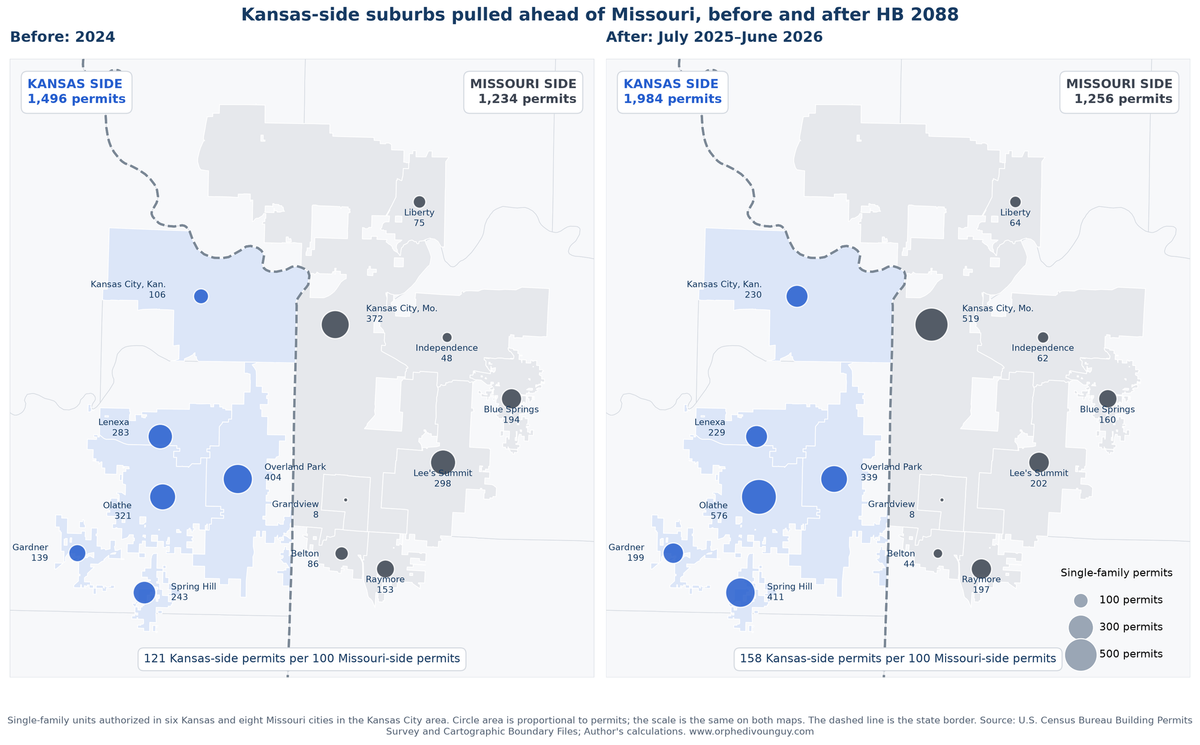
Single-family permits surged around the time Kansas introduced a 60-day approval deadline. But a closer look at when and where the increase occurred raises important questions about what caused it.
Key Takeaways
- Kansas outperformed its synthetic comparison. From July 2025 through August 2026, the state authorized approximately 19.5% more single-family housing units than our model predicted, a difference of roughly 1,229 additional authorizations.
- The timing and location raise questions about causality. The increase began in early 2025, while the bill was still being debated and before it took effect, although the gap continued to widen afterward. And two Kansas City suburbs, Olathe and Spring Hill, account for nearly half of the statewide increase. Both publish permit-review standards far faster than the new 60-day deadline.
- Kansas-side suburbs were already pulling ahead of their Missouri neighbors before the reform. In 2023, six Kansas-side cities in the Kansas City area authorized about 80 homes for every 100 authorized in eight Missouri-side cities. By 2024, before the bill was introduced, that figure had reached 121. In the year after the law took effect, it was 158. Because the gap was already widening before the law existed, we cannot separate the reform’s effect from the existing trend.
- The underlying constraint remains uncertain. In Overland Park, about 97% of new single-family permits from 2024 applications were issued within 60 days, and wait times did not shorten after the law took effect. Olathe, Lenexa and Spring Hill published residential review standards well below 60 days. That raises questions about whether the deadline was binding in these markets at all. Our test covers only the local review deadline, not the law’s 45-day state stormwater deadline or its ban on mid-application rule changes.
The root of our country’s affordability crisis is a massive shortfall of housing units due to multiple decades of underbuilding. And when developers face long delays getting permission to build, those delays can increase costs and discourage new construction.
Kansas decided to address the problem.
In April 2025, Kansas enacted HB 2088, the Fast-Track Permits Act, which took effect July 1, 2025. The law requires local governments to approve or deny complete single-family building permit applications within 60 days, and to tell applicants within 15 days if an application is incomplete. If a government misses the deadline, the application is treated as approved.
The law also does two other things. It bars local governments from applying rules adopted after an application is submitted. And it requires the Kansas Department of Health and Environment to rule on construction stormwater permits within 45 days.
The economic argument is straightforward: reduce unnecessary delays, increase predictability and you make it easier to build more homes.
But did the reform actually help to boost construction?
Our analysis of Census permitting data finds a substantial increase in single-family authorizations around the reform. Yet investigating the timing, geographic distribution and existing permitting practices reveals a more complicated story.
The most telling detail is where the growth happened. Two Kansas City suburbs, Olathe and Spring Hill, account for nearly half of the statewide increase. According to their own published standards, both were already reviewing new-home permits within two weeks, far faster than the 60-day limit the law imposed. A deadline that did not bind in those places is an unlikely explanation for their surge.
Synthetic control points to an increase in permitting activity
To determine whether HB 2088 increased housing authorizations, we need to establish what would have happened in Kansas without the reform. Ideally, we would identify a state that closely tracked Kansas’s permitting activity before the legislation and examine whether their trends diverged afterward. The challenge is that no single state provides a sufficiently close comparison. Kansas differs from its neighbors in housing demand, construction activity and economic conditions.
That’s where the synthetic control method comes in. Developed by Abadie, Diamond, and Hainmueller (2010), the approach combines multiple states to construct a more credible comparison. In our analysis, a weighted combination of states—including Missouri, Ohio, New York and Illinois—closely reproduces Kansas’s permitting patterns before the reform. Missouri and Ohio receive the largest weights, but the result does not depend on either one. Dropping each comparison state with at least a 1% weight leaves the estimated post-implementation gap between 18.6% and 20.6%. Dropping Missouri and Ohio together gives 18.7%.
We constructed this synthetic Kansas using monthly single-family permitting data from 2019 through 2024, before HB 2088 was introduced. The model’s pre-reform fit provides a benchmark for evaluating whether Kansas subsequently diverged from its historical trajectory. If permitting activity increased substantially in Kansas but not in its synthetic counterpart, that would be consistent with an effect of the legislation, although other Kansas-specific developments that coincided with the reform could also explain the difference.
Kansas subsequently outperformed its modeled counterfactual.
| Synthetic-control result | Estimate |
|---|---|
| Legislative period, February–June 2025 | +15.8% |
| Post-implementation window, July 2025–August 2026 | +19.6% |
| Additional authorized units relative to model, post-implementation | 1,229 |
| Pre-2025 model fit, normalized RMSE | 7.7% |

The magnitude is economically meaningful.
We repeated the analysis as if each comparison state had passed the law instead of Kansas. Among the 31 states included, Kansas had the largest percentage increase above its model’s prediction after the law took effect. That makes Kansas’s increase unusual, but it does not tell us whether the law—or other changes in Kansas—caused it.
The increase began before the law took effect. Kansas started outpacing its synthetic counterpart in March 2025, while the bill was still moving through the Legislature. The gap widened after implementation: Kansas ran about 12% above its synthetic comparison in 2025 and about 25% above it in the first eight months of 2026.
The early start could reflect anticipation of the reform. It could also reflect strengthening housing demand, available lots, or other Kansas-specific conditions. One example is Panasonic Energy’s electric-vehicle battery plant in De Soto, in western Johnson County. It began mass production in July 2025 after hiring roughly 1,000 workers and was expected to hire more workers. That is a potential source of new housing demand in nearby suburbs such as Olathe, Spring Hill and Gardner.
To distinguish these explanations, we examined where the additional permits originated.
A handful of jurisdictions account for much of the increase—and their timing differs
Kansas’s statewide increase was not uniform. To see where it came from, we compared each jurisdiction’s permits from July 2025 through August 2026 with its permits in the same calendar months of 2024. Because the window spans 14 months, July and August 2024 are counted twice. By that measure, Kansas authorized 1,151 more single-family units than its 2024 pace.
This year-over-year comparison is simpler than the synthetic-control estimate of 1,229 units. The synthetic control compares Kansas with other states; this comparison measures Kansas only against its own past.
Olathe and Spring Hill accounted for 565 of those additional permits, nearly half the statewide net increase relative to the matched 2024 benchmark.
| Jurisdiction | Change versus matched 2024 months | Growth |
|---|---|---|
| Olathe | +293 | +76.3% |
| Spring Hill | +272 | +96.5% |
| Kansas City, Kan. | +137 | +103.8% |
| Bel Aire | +78 | +177.3% |
| Gardner | +73 | +44.8% |
| Overland Park | −106 | −21.9% |
| Lenexa | −60 | −18.0% |

The timing is particularly revealing.
Spring Hill’s permitting activity more than doubled between 2023 and 2024, before HB 2088 was introduced. Authorizations were virtually unchanged in Olathe between 2023 and 2024, but then they rose sharply in 2025.
In Kansas City, Kansas, permits nearly doubled, from 106 in 2024 to 210 in 2025. In both Kansas City, Kansas, and Olathe, the sharpest acceleration came in spring 2025, between the bill’s signing on April 7 and its effective date on July 1. Both cities kept permitting at those higher levels into 2026.
Meanwhile, Overland Park and Lenexa issued fewer permits than in 2024, despite being subject to the same statewide law. Those declines partly reflect an unusually strong 2024 in both cities. Overland Park’s permits jumped from 251 in 2023 to 404 in 2024, and Lenexa’s from 148 to 283. Measured against 2023, both cities issued more permits in 2025.
These differences suggest that local housing-market conditions likely played a more important role.
Kansas-side localities were already pulling ahead of Missouri before the reform
We then compared six Kansas municipalities with eight Missouri municipalities in the Kansas City metropolitan area. This offers a useful test since the jurisdictions share a broader regional housing market but were not subject to the same state legislation.
| Period | Kansas-side permits | Missouri-side permits | Kansas-side per 100 Missouri-side |
|---|---|---|---|
| 2023 | 1,099 | 1,373 | 80 |
| 2024 (before the bill) | 1,496 | 1,234 | 121 |
| Jan–Jun 2025 (legislative session) | 911 | 589 | 155 |
| Jul 2025–Jun 2026 (after the law took effect) | 1,984 | 1,256 | 158 |

The results complicate the causal interpretation. The Kansas advantage did not appear with the reform. It was already growing in 2024, more than a year before the law took effect. Permits on the Kansas side rose 36% from 2023 to 2024, while permits on the Missouri side fell 10%.
The gap widened further during the 2025 legislative session and has held at that higher level since the law took effect. In the first full year after implementation, Kansas-side permits were 33% above their 2024 level. Missouri-side permits were up 2%.
That pattern fits a story in which housing demand was already shifting toward the Kansas side of the metro. It is also consistent with a modest reform effect layered on top of that trend. Because the gap was widening before the bill existed, these data cannot tell us how much of the later gap, if any, the law caused.
We compare permit levels rather than annual growth rates for a reason. A lasting jump in permitting shows up as a one-year spike in growth, followed by a return to normal growth. A shrinking growth gap is therefore not, by itself, evidence that a reform failed.
Was the 60-day deadline actually binding?
A reform intended to remove a regulatory constraint should have its largest direct effects where that constraint previously restricted activity.
We asked: how frequently were Kansas homebuilders having to wait more than 60 days for a new permit?
We investigated permitting practices in six jurisdictions that collectively accounted for 35.8% of Kansas’s estimated single-family permits in 2024: Wichita, Overland Park, Olathe, Lenexa, Spring Hill and Lawrence.
The available evidence raises questions about how frequently the new deadline would have constrained routine permitting.
Overland Park provides the clearest example. Using individual permit records, we find that among new single-family applications submitted in 2024 and subsequently issued, the median application-to-issuance time was approximately 14–18 days, depending on the quarter. Approximately 97% were issued within 60 days of initial submission.
Overland Park’s records also show no sign that the law sped things up. For applications filed after the law took effect, the median wait was 16 days, essentially unchanged from 17 days before 2025. The share of permits taking longer than 60 days did not fall: it was about 6%, compared with 4% before.
This is consistent with what the city told lawmakers. In March 2025 testimony, Overland Park said it could generally meet the bill’s 15- and 60-day timelines for single-family permits.
Other jurisdictions reported similarly short review timelines or performance benchmarks.
| Jurisdiction | Share of Kansas permits, 2024 | Pre-reform permitting evidence |
|---|---|---|
| Overland Park | 7.5% | About 97% of observed 2024 single-family applications that received permits were issued within 60 days; median 14–18 days. No reduction in wait times after the law took effect. |
| Wichita | 10.3% | Not comparable: 95.1% of all building and trade permits (not only new homes) issued within one day in 2024 |
| Olathe | 5.9% | Published typical residential plan-review time of five business days |
| Lenexa | 5.2% | Published residential review period of five business days |
| Spring Hill | 4.5% | Published new-residential review timeframe of 10–14 days (current standard; not confirmed for 2024) |
| Lawrence | 2.3% | In 2018, 95.3% of initial residential reviews were completed within five business days; average 2.6 days |
The strength of this evidence varies. Direct, permit-level evidence for new single-family homes is available only for Overland Park, about 7.5% of statewide permits. Adding the published review standards for Olathe, Lenexa and Spring Hill and the historical figures for Lawrence brings coverage to about a quarter of statewide permits (25.5%). Wichita reports that 95% of building and trade permits were issued within one day in 2024. But that figure mixes simple trade permits, such as electrical or plumbing work, with new-home permits, so we cannot rely on it.
Since approval comes before issuance, a permit issued within 60 days of initial submission would also have been approved within 60 days of the completed application.
This matters because of where the growth occurred. Olathe and Spring Hill, which together account for nearly half of Kansas’s increase, both publish review standards of two weeks or less. If the 60-day deadline did not constrain permitting in those cities, it is hard to credit the deadline with their surge.
If routine permitting was already faster than the new 60-day deadline, then the reform would have had a very limited scope to accelerate approvals in Kansas.
One important caveat: our test covers only the law’s 60-day local review deadline. The law’s other two provisions, the 45-day state stormwater deadline and the ban on mid-application rule changes, could matter most for large new subdivisions. That is the kind of development behind growth in Spring Hill, Olathe and Gardner, and these provisions could bite even where city building-permit reviews were already fast. We have not measured whether they changed builders’ timelines.
Future research should test whether the 60-day deadline was nonbinding statewide. That requires complete application histories, including pending and denied applications. It should also examine the law’s other provisions, starting with whether state stormwater-permit decisions became faster after July 2025.
Appendix
We examined whether single-family permits in Kansas rose after HB 2088 took effect on July 1, 2025. The analysis has three parts: a statewide synthetic control, local comparisons, and a review of local permitting times. Together, they assess the size, timing and possible causes of the increase. They do not isolate the effect of each provision of the law.
Data and outcome. We used monthly data from the U.S. Census Bureau’s Building Permits Survey, January 2019 through August 2026. The outcome is the number of privately owned housing units in one-unit buildings authorized by permits. Statewide estimates use Census state files. Local comparisons use permit-office files. The data are not seasonally adjusted and may include imputed values and later revisions. Permits do not measure construction starts or completed homes.
Synthetic comparison. We built a “synthetic Kansas” from a weighted mix of other states. First, we divided each state’s monthly permits by its own average for January 2019 through December 2024. We then chose weights that best matched Kansas’s pattern over those 72 months. Weights cannot be negative and must sum to one. Finally, we converted the weighted series back into housing units using Kansas’s pre-2025 average. The weights therefore match permitting patterns, not the size of each state’s market.
The final comparison group contains 39 states. We excluded ten states with permit-review laws that could overlap with the study period: Arizona, Arkansas, Florida, Indiana, Minnesota, Rhode Island, Texas, West Virginia, Wisconsin and Wyoming.
Evaluation periods and validation. We measured two periods separately: the legislative session (February–June 2025) and the period after the law took effect (July 2025–August 2026). We left out January 2025 because the bill was introduced on Jan. 23. For each period, the percentage gap compares total actual permits with total synthetic permits. The unit gap adds up the monthly differences.
To judge fit, we divided the model’s typical monthly prediction error by Kansas’s average monthly permits. We also ran an out-of-sample test: we fit the weights through December 2022 and checked predictions for 2023–2024. Robustness checks included:
- changing the comparison group;
- dropping each state with at least 1% weight;
- dropping Missouri and Ohio together;
- comparing the national model with a Midwest-only model.
Placebo comparisons. We repeated the analysis 39 times, each time treating a different comparison state as if it had passed the law. Kansas was never used to build these placebo comparisons. Our main test kept placebo states whose pre-2025 fit was no worse than twice Kansas’s. We also checked the results with no fit filter and with the stricter rule in Abadie, Diamond and Hainmueller (2010). We compared two measures: the post-implementation percentage gap, and the ratio of post-period to pre-period prediction error.
Kansas’s rank equals one plus the number of placebo states with a result at least as large as Kansas’s, divided by one plus the number of placebo states. This shows how unusual Kansas’s gap is within the comparison group. A low rank alone does not prove the law caused the gap.
Local comparisons. We compared each Kansas jurisdiction’s permits from July 2025 through August 2026 with the same calendar months of 2024. Because the window spans 14 months, July and August 2024 count twice. Each jurisdiction’s contribution is its change from that benchmark, divided by the statewide change. This comparison is separate from the synthetic-control estimate.
We also compared six Kansas cities with eight Missouri cities in the Kansas City metro. We focused on permit levels and on the ratio of Kansas-side to Missouri-side permits. These cities share a regional economy. Still, the comparison cannot rule out differences in demand, land supply or development pipelines.
Permitting times. We used Overland Park’s public permit records for permits classified as new single-family construction. For each permit, we counted the calendar days from application to issuance. We grouped permits by when the application was filed and compared median wait times and the share taking more than 60 days. The records run through Sept. 30, 2026.
These records have limits. They exclude pending and denied applications. Recent applications have had less time to be issued. The time from application to issuance also differs from the legal deadline. That deadline starts with a complete application, excludes holidays, and does not apply when builders agree to phased permitting.
We added city testimony, published review standards and past performance reports. These sources cover different years and permit types. Some measure only the first review, not final approval. Current standards cannot show actual wait times before the law. Our analysis therefore documents an increase relative to a modeled comparison and examines possible explanations. It does not attribute the whole increase to HB 2088.
Sources
- U.S. Census Bureau, Building Permits Survey. Survey documentation, monthly state files and Midwest permit-office files.
- Abadie, Alberto, Alexis Diamond and Jens Hainmueller. 2010. “Synthetic Control Methods for Comparative Case Studies: Estimating the Effect of California’s Tobacco Control Program.” Journal of the American Statistical Association 105(490): 493–505. https://doi.org/10.1198/jasa.2009.ap08746
- Abadie, Alberto. 2021. “Using Synthetic Controls: Feasibility, Data Requirements, and Methodological Aspects.” Journal of Economic Literature 59(2): 391–425. https://doi.org/10.1257/jel.20191450
- City of Overland Park. Public Building Permit Report GIS service. Fields used: application date, issuance date and permit classification.
- Kansas Legislature. HB 2088 (2025), the Fast-Track Permits Act, codified at K.S.A. 2025 Supp. 12-16,224 through 12-16,226: bill history, enrolled text, and K.S.A. 12-16,225, with July 1 effective date.
- City of Overland Park. Testimony to the Senate Committee on Commerce, March 5, 2025. On the city’s ability to meet the proposed single-family timelines.
- City of Olathe. Permit Plan Review and Building Permit Application Guide. Published residential review and resubmittal times.
- City of Spring Hill. New Residential Construction. Current review guidance for plans and forms.
- City of Lenexa. Remodeling Projects. Five-business-day review for residential permits and revisions. Does not establish past new-home approval times.
- City of Lawrence. March 2019 Building Permit Activity memorandum. Residential initial-review performance for 2018.
- Sedgwick County. 2026 Recommended Budget, Metropolitan Area Building and Construction Department, Strategic Results. 2024 processing times for combined building and trade permits.
- Kansas Department of Commerce. Governor Kelly Celebrates Grand Opening of Panasonic EV Battery Manufacturing Facility in De Soto, July 14, 2025.