July 2026 PCE: Inflation Stubborn, Incomes Rose, Spending Stalled

Underlying inflation didn't budge — and core PCE landed almost exactly where our producer-price nowcast said it would.
Key Takeaways
- Income outran spending. Disposable income rose 0.5% in July (0.4% after inflation) while spending was essentially flat, so the saving rate ticked up to 3.0% — though over the past year real disposable income is up just 0.5%.
- Real spending stalled. Adjusted for inflation, consumer spending was unchanged on the month — a pause after a strong spring, concentrated in a pullback on goods.
- Inflation is still stuck. PCE prices rose 3.7% over the year and core 3.3% — both roughly unchanged from June. The stickiness is in services.
- Our core call was right. Two weeks ago our producer-price nowcast pegged July core PCE at about +0.24% for the month. It printed +0.25% — right on top of the forecast, ~3% annualized, still above the Fed's 2% target.
Income up, spending flat
Personal income rose 0.4% in July, and disposable income — what's left after taxes — rose 0.5%. Crucially, that gain survived inflation: real disposable income rose 0.4% on the month, so this was a genuine increase in buying power, not just a price-driven bump in the dollar figure. Spending, by contrast, barely moved — nominal spending was up 0.2%, and after adjusting for inflation, real spending was flat (+0.01%).
So for the first month in a while, paychecks grew faster than purchases — and grew in real terms. That's the reverse of the spring pattern, when spending outran income and households leaned on savings to cover the gap.
The catch is the annual picture. Over the past year, real disposable income is up only about half a percent — essentially flat — while real spending is up 2.1%. And with real disposable income barely higher than a year ago, that additional spending is increasingly being financed through lower saving and accumulated wealth rather than stronger real income growth.
It helps explain why household sentiment can feel much worse than headline GDP or the unemployment rate would suggest.
Inflation still starts with a 3
The PCE price index — the Fed's preferred inflation gauge — rose 0.2% in July and 3.7% over the year. Core prices, which strip out food and energy, rose 0.3% on the month and 3.3% over the year. Both annual figures are roughly where they sat in June — if anything, a hair firmer, not softer.
The split underneath the monthly number: goods prices softened while services remained firm. Core has now run near 3% annualized over the last three months — not accelerating, but not breaking toward the Fed's 2% target either.
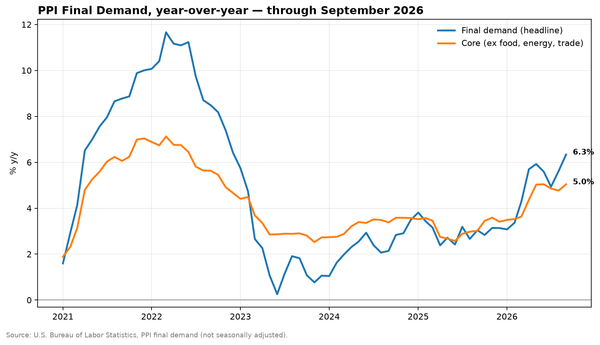
How it compared to our forecast. Two weeks ago, reading July's producer prices, we flagged that the calm PPI headline was hiding firming in exactly the categories that feed PCE — financial services, health care, and airfares — and our backtested nowcast pointed to core PCE around +0.24% for the month, roughly 3% annualized.
It landed at +0.25%. One-hundredth of a percentage point off, squarely inside the range we gave. The single biggest upside risk we named — a 6.5% jump in portfolio-management fees in the producer data — showed up directly in this report, where the price of portfolio-management services posted one of its sharpest monthly increases. The producer-price signal did its job: the parts of PPI that flow into PCE told us where core would land, two weeks before BEA published it.
Where the money went
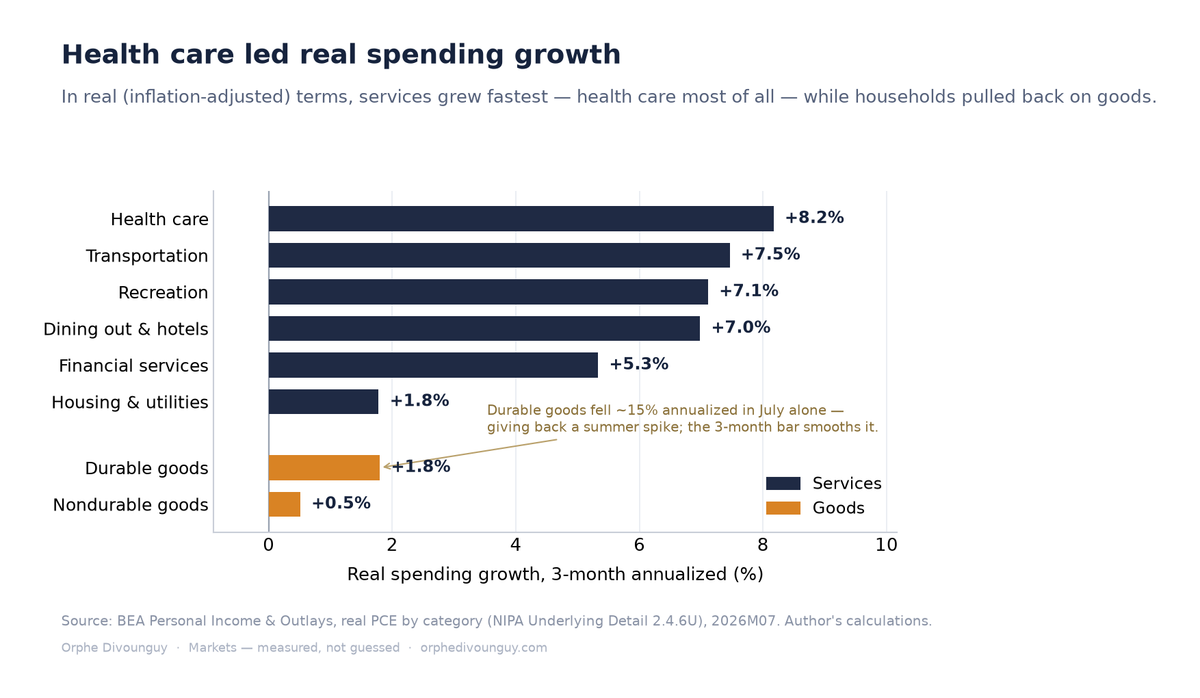
In real terms, the month was a clean rotation out of goods and into services.
Consumers spent more on:
- Health care — up at an 8% annualized pace over the last three months, the strongest of the major categories.
- Transportation services and recreation — both running north of 7% annualized over three months.
- Dining out — food services and accommodations picked up after a soft spring.
- Cars — a sharp one-month jump in new-vehicle purchases.
Consumers pulled back on:
- Durable goods overall — down sharply on the month, giving back a spike from earlier in the summer. Outside of autos, the drop was in furniture, appliances, and recreational goods.
- Nondurable goods — a smaller decline.
- Housing and utilities — barely growing, up about 1% over the year.
In plain terms: households kept paying up for services — especially health care — while cutting back on the big-ticket household goods they'd splurged on a month earlier.
Data: U.S. Bureau of Economic Analysis, Personal Income and Outlays, July 2026; FRED (PI, DSPI, PCE, DSPIC96, PCEC96, PSAVERT, PCEPI, PCEPILFE); BEA NIPA Underlying Detail tables for category-level real spending. Series pulled directly from the BEA and FRED APIs on release. Core-PCE forecast from the author's out-of-sample producer-price nowcast.