July 2026: New-Home Sales Settle Back to a Lackluster Pre-Pandemic Pace

Key Takeaways
- Sales missed. New-home sales fell to a 607,000 seasonally adjusted annual rate (SAAR) — down 10.5% for the month (±14.0%) and 6.3% below a year ago (±19.6%). The 607,000 pace was below major consensus estimates clustered around 615,000–620,000. June was revised up to a 678,000 rate.
- Months' supply is elevated. Months’ supply jumped to 9.6 — up 12.9% for the month (±21.3%) and 4.3% above a year ago (±25.2%). It is well above its 2016–2019 average and the highest since January.
- Only luxury grew. Luxury was the only price tier with higher year-to-date sales. From January through July, sales of homes priced at $1M+ were about 5% higher than in the same period a year ago. Every other price tier declined.
What happened
The 10.5% one-month drop overstates the trend. June was unusually strong — revised up to a 678,000 rate — so part of July’s decline is payback, and the monthly figure carries a wide margin of error (±14.0%). Census notes that it takes four months to establish a trend in new-home sales. A single month, on its own, tells you very little.
Still, the miss is directionally consistent with a softer market. At 607,000, sales came in below consensus and 6.3% under a year ago, although Census cannot statistically distinguish either sales decline from zero at the 90% confidence level. The more useful signals are the year-to-date pace and an elevated months’ supply. Together they point to softer demand and more leverage for buyers. Builders are responding: NAHB’s July survey found 63% were using sales incentives and 37% were cutting prices.
The big picture
- The rate backdrop reversed. Mortgage rates briefly dipped below 6% in late February and have since climbed back near a one-year high, reaching 6.65% on August 20 (Freddie Mac). Affordability deteriorated with them — the payment on the typical U.S. home is up roughly $146 a month versus February — and that reversal helps explain why the expected housing recovery has lost momentum.
- Demand is soft. July new-home sales were estimated 6.3% below year-ago levels. Through the first seven months of the year, Census puts sales down 4.1% from the same period of 2025 — the weakest January–July pace since 2017. The year-to-date decline is also not statistically significant (±5.6%), but the level is clearly well below the pandemic-era boom.
- Inventory is elevated, and builders are leaning on incentives. At July’s pace it would take 9.6 months to clear the 488,000 new homes on the market, up from 8.5 in June and well above the 2016–2019 average. NAHB’s July survey found 63% of builders using sales incentives and 37% cutting prices, with an average price reduction of 6%.
- The mix is tilting toward the two ends. Census’s official July price distribution puts homes under $400,000 at 53% of sales, up from 50% a year ago. Homes priced at $1M or more rose to 5% from 3%. The $400,000–$1M middle fell to 42% from 46%, consistent with the financing-sensitive middle taking the biggest hit.

At 9.6 months, the stock of new homes for sale is high relative to the current sales pace. That imbalance is the backdrop for everything else in this report: it helps explain why builders are competing on price and financing, and why the median sale price has drifted lower even as the mix of what’s selling shifts. For buyers who can still transact, elevated supply and widespread incentives create meaningful negotiating leverage on new construction.
Momentum: the year-to-date picture
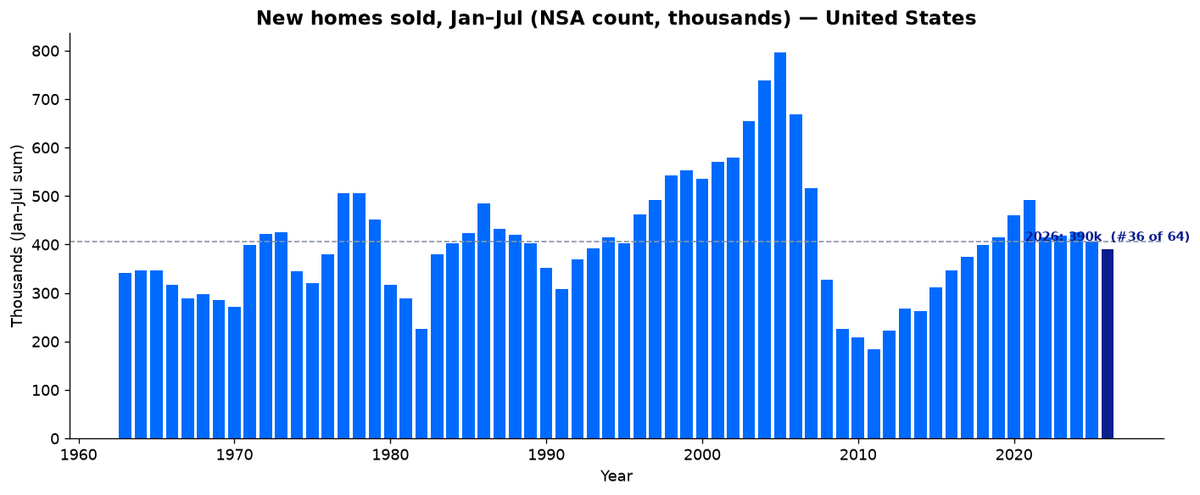
Looking through the monthly noise at the January–July totals (not seasonally adjusted) tells a calmer story than the −10.5% July headline.

Through the first seven months of 2026, builders sold about 390,000 new homes — down 4.1% from the same stretch of 2025, according to Census, and the slowest January–July since 2017. But “slowest since 2017” needs context: 2026 is still running about 2% above the 2016–2019 average, so sales have essentially returned to their pre-pandemic normal rather than fallen below it. Today feels soft mainly because of the comparison to the 2020–2021 boom — measured against the last five years, which include those surge years, 2026 is down roughly 10%. With mortgage rates where they are, new-home demand has cooled from a frenzy back to something ordinary.

The national number masks a clear interior-versus-coastal split. Using published monthly counts for the historical comparison, the South is running about 9% above its 2016–2019 January–July average and the Midwest about 6% above, even though both have cooled from last year. The West and Northeast sit roughly 16–18% below that same pre-pandemic baseline. The pattern is consistent with affordability: new-home demand is holding up better where budgets stretch further and pulling back more where prices are highest. The South remains the market’s center of gravity, accounting for roughly 61% of new homes sold nationwide year-to-date.

That price mix helps explain an apparent puzzle in the headline numbers: the median sale price fell 0.9% over the year while the average rose 5.4%. Census cautions that changes in reported prices reflect shifts in the distribution of homes by region, size and other characteristics as well as changes in like-for-like prices. July’s barbell shift fits that story: a larger low-price share can pull the median down while a firmer $1M-plus tail lifts the average. Through July, sales of homes priced at $1M or more are up about 5% from the same period a year ago.
| Price tier | 2025 | 2026 | Change | % change |
|---|---|---|---|---|
| Entry (<$400k) | 188 | 186 | −2 | −1.1% |
| Middle ($400–600k) | 127 | 122 | −5 | −3.9% |
| Higher-end ($600k–$1M) | 67 | 56 | −11 | −16.4% |
| Luxury ($1M+) | 22 | 23 | +1 | +4.5% |
Source: U.S. Census Bureau, Survey of Construction. Counts in thousands and are sums of published monthly estimates; totals and percentage changes can differ slightly from Census year-to-date figures because the published monthly counts are rounded.
The bottom line
New-home sales missed in July, months’ supply rose to 9.6 — its highest since January — and the mix of what’s selling shifted toward both ends of the price distribution as the $400,000–$1M middle lost share.
Step back from the one-month drop and the year-to-date read is steadier: sales are running roughly where they were before the pandemic, not collapsing — but with a sharp divide underneath, holding up better across the affordable interior and pulling back on the expensive coasts. Builders can still move homes. They’re increasingly doing it with rate buydowns, incentives and price cuts, and that reliance on support tells you where the housing market stands: demand has cooled from a frenzy to ordinary, and affordability remains the central constraint.
Sources: U.S. Census Bureau and U.S. Department of Housing and Urban Development, New Residential Sales, July 2026; Census Survey of Construction historical price-range files; NAHB/Wells Fargo Housing Market Index, July 2026; Freddie Mac Primary Mortgage Market Survey and Zillow home-value data for the mortgage-payment comparison. Consensus references are the Wall Street Journal and Reuters economist polls. Margins of error are 90% confidence intervals; Census marks changes whose intervals include zero as not statistically significant.