Housing Demand: Somewhat Resilient In The Face of Rising Mortgage Rates

Mortgage rates have climbed back near a one-year high. Months of supply have risen, pointing to weaker price growth.
Key Takeaways
- Higher mortgage rates caused housing affordability to deteriorate. The payment on the typical U.S. home has risen about $146 a month when compared to February. Despite that, the pool of buyers remains somewhat unchanged from a year ago level.
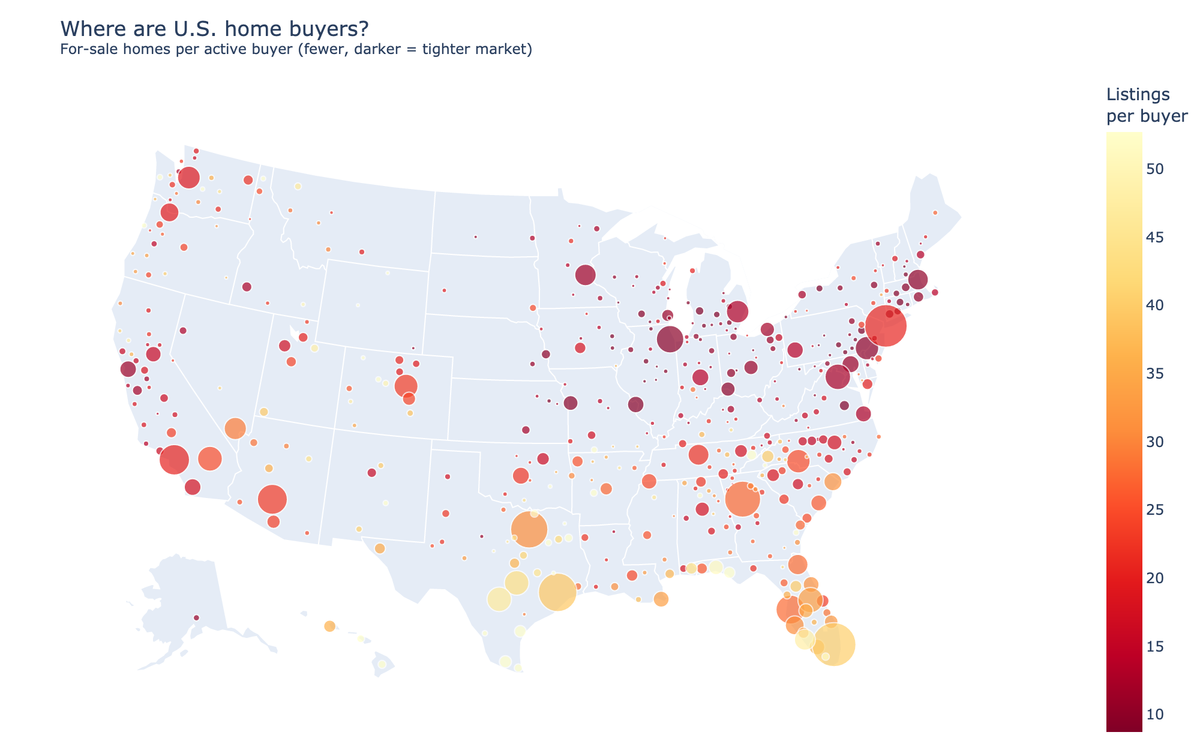
- A slight decline in the number of buyers competing for homes is causing months of supply to build. Buyers per active listing remain near one-third of their early-2022 peak, with the loosest conditions concentrated across much of the Sun Belt.
- Higher months of supply will weigh on prices. Markets with higher months of supply are seeing weaker home-value growth. That relationship is strongest about three to four months later.
Affordability has worsened and the housing market has loosened slightly.
After falling to roughly 6% in February, mortgage rates have climbed all the way back and are now sitting above year-ago levels. As a result, housing market activity has slowed but only modestly.
According to Zillow data for the four weeks through July 18, home sales were running about 3.2% above a year ago — though that year-over-year gain has narrowed from roughly 5.1% a month earlier. New listings were up about 0.9% from a year earlier, also cooling from 1.2%.
Across every series the market is running modestly ahead of the depressed year-ago pace even as this year’s momentum fades — and a model-implied buyers per active listing remain near one-third of their early-2022 peak and roughly unchanged from a year ago.
Mortgage rates took back the spring relief
The 30-year fixed mortgage rate briefly fell below 6% in late February — its lowest in more than three years — before climbing back; as of August 20 it stood at 6.65%, near a one-year high. On a monthly-average basis, it rose from 6.05% in February to 6.54% in July.
That move matters. The typical U.S. home is now worth about $372,000. With 20% down, the principal-and-interest payment on that home at July’s average rate was about $1,888 a month. In February, when rates averaged 6.05% and the typical home was a little cheaper, that payment would have been about $1,742. The change represents an increase of roughly $146 a month, or $1,752 a year.
About $92 of the monthly increase — roughly 60% — comes from the higher mortgage rate alone. The rest reflects the increase in home values since February. (Figures are principal and interest only; taxes and insurance are excluded.)
The dollar hit is largest in expensive markets because the same change in mortgage rates applies to a much larger loan balance. Among the 50 largest markets, the annual increase ranges from about $1,008 in the least expensive market (Memphis) to about $6,072 in the most expensive (San Francisco). The full table appears at the end of this article.
Still way more homes for sale than there are buyers
To compare demand across markets, I use a standard housing search-and-matching model to translate sales and for-sale inventory into a measure of the number of buyers in the housing market.
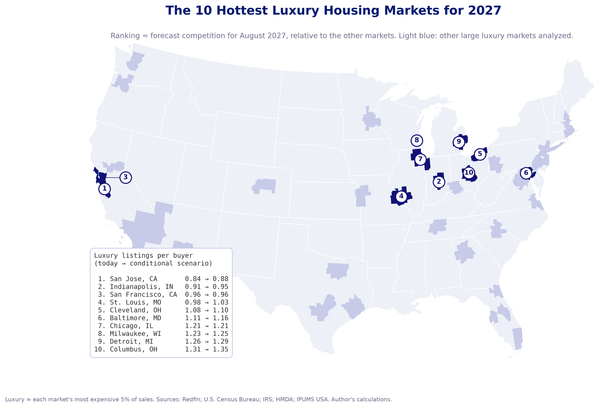
Relative to the number of active buyers, existing homes for sale are far more plentiful than during the 2021–22 frenzy — there are roughly three times as many listings per buyer as at the early-2022 peak, and about as many as a year ago.
The geography is striking. The housing market remains relatively tighter across much of the Northeast and Midwest, where inventory is relatively scarce and homes continue to move quickly.
Throughout the Sun Belt, listings are more plentiful relative to demand, and buyers have considerably more choice.
That is the market divide right now — tight in places like Hartford and Buffalo, much looser across large parts of Texas, Florida and the Southwest.

Months’ supply points to weaker price growth
The more interesting result is what happens next. Across 49 of the 50 largest metros with complete data, markets that carried more months of supply in the preceding three-month window are now seeing weaker home-value growth. The correlation is −0.52. Months of supply measures how long current housing inventory would take to sell at the current pace of sales.
Buffalo and Hartford entered the period with relatively lower months’ supply last quarter and are posting some of the strongest gains in home values during the current quarter. At the other end, San Antonio, Austin, Houston and Miami carried much higher months’ supply and are seeing considerably weaker appreciation; Phoenix and Las Vegas have slipped slightly negative in the current quarter. There are exceptions — San Jose, for example, has relatively little months’ supply yet home values have fallen.

Still, the broader relationship is clear: where inventory is high relative to the pace of sales, price growth is losing support.
Mortgage rates have taken back the relief buyers got earlier this year but the housing market is not collapsing. Buyer pressure remains weak — roughly where it was a year ago.
Methodology
Housing-market data are from Zillow’s research data. The weekly inventory, sales and new-listing series are smoothed rolling averages; the latest weekly observations used here run through July 18, 2026. Home values are from the Zillow Home Value Index through July. Because the weekly series are smoothed, they are compared as rolling averages rather than treated as literal monthly transaction totals.
The measure of buyers is estimated using a standard search-and-matching framework in which sales depend on the stocks of buyers and homes for sale, with matching elasticity set to 0.16 and matching efficiency normalized to one following the housing search academic literature. As a robustness check, Zillow median days-to-pending correlates 0.84 with the sales-and-inventory measure of time-to-sell, and the two resulting buyer series have a within-market correlation of 0.73.
Months of supply measures for-sale inventory relative to the monthly sales pace, where the sales pace is average weekly sales scaled to a month. Home-value growth in the metro comparison is the average monthly ZHVI growth rate over the latest three months. In a separate panel regression using the full metro history, higher months of supply predicts weaker subsequent home-value growth after controlling for metro and month-year fixed effects and the previous three months of price growth, with standard errors clustered by metro and month; the relationship is strongest roughly three to four months later.
Mortgage rates are from Freddie Mac’s Primary Mortgage Market Survey. Mortgage-payment calculations use a 20% down payment and a 30-year fixed-rate mortgage and include principal and interest only.
Monthly mortgage payment on the typical home, February vs July
| Metro | February value | July value | Increase/mo | Increase/yr |
|---|---|---|---|---|
| United States | $361,287 | $371,757 | $146 | $1,752 |
| San Francisco, CA | $1,099,780 | $1,143,620 | $506 | $6,072 |
| San Jose, CA | $1,558,765 | $1,569,703 | $457 | $5,484 |
| San Diego, CA | $915,256 | $936,560 | $344 | $4,128 |
| Los Angeles, CA | $947,296 | $966,820 | $343 | $4,116 |
| Boston, MA | $714,369 | $743,469 | $332 | $3,984 |
| New York, NY | $713,110 | $739,990 | $320 | $3,840 |
| Providence, RI | $507,676 | $531,026 | $250 | $3,000 |
| Seattle, WA | $734,286 | $741,028 | $223 | $2,676 |
| Hartford, CT | $381,997 | $405,762 | $219 | $2,628 |
| Sacramento, CA | $570,036 | $582,570 | $211 | $2,532 |
| Milwaukee, WI | $371,068 | $393,714 | $211 | $2,532 |
| Washington, DC | $568,852 | $581,129 | $209 | $2,508 |
| Portland, OR | $538,875 | $550,185 | $196 | $2,352 |
| Denver, CO | $558,993 | $567,979 | $190 | $2,280 |
| Salt Lake City, UT | $558,108 | $567,006 | $189 | $2,268 |
| Riverside, CA | $579,894 | $586,925 | $185 | $2,220 |
| Chicago, IL | $343,136 | $361,494 | $182 | $2,184 |
| Philadelphia, PA | $377,480 | $393,122 | $177 | $2,124 |
| Minneapolis, MN | $380,031 | $394,679 | $172 | $2,064 |
| Richmond, VA | $384,155 | $398,387 | $171 | $2,052 |
| Buffalo, NY | $274,376 | $292,737 | $164 | $1,968 |
| Miami, FL | $470,584 | $478,760 | $162 | $1,944 |
| Nashville, TN | $446,833 | $455,148 | $158 | $1,896 |
| Baltimore, MD | $393,606 | $404,816 | $158 | $1,896 |
| Kansas City, MO | $316,317 | $331,205 | $157 | $1,884 |
| Virginia Beach, VA | $364,213 | $376,678 | $157 | $1,884 |
| Raleigh, NC | $430,583 | $436,918 | $143 | $1,716 |
| Columbus, OH | $321,093 | $332,969 | $143 | $1,716 |
| Cincinnati, OH | $299,115 | $311,118 | $138 | $1,656 |
| St. Louis, MO | $265,930 | $278,129 | $131 | $1,572 |
| Cleveland, OH | $241,256 | $254,758 | $131 | $1,572 |
| Charlotte, NC | $381,645 | $387,653 | $129 | $1,548 |
| Atlanta, GA | $375,548 | $381,578 | $128 | $1,536 |
| Austin, TX | $420,839 | $424,478 | $127 | $1,524 |
| Detroit, MI | $258,783 | $270,291 | $125 | $1,500 |
| Phoenix, AZ | $444,272 | $445,622 | $121 | $1,452 |
| Tampa, FL | $356,004 | $361,516 | $120 | $1,440 |
| Jacksonville, FL | $346,953 | $352,756 | $119 | $1,428 |
| Dallas, TX | $359,632 | $364,682 | $118 | $1,416 |
| Indianapolis, IN | $287,802 | $295,966 | $116 | $1,392 |
| Orlando, FL | $383,122 | $386,386 | $115 | $1,380 |
| Las Vegas, NV | $427,235 | $428,201 | $115 | $1,380 |
| Louisville, KY | $274,506 | $282,162 | $110 | $1,320 |
| Birmingham, AL | $255,489 | $263,910 | $108 | $1,296 |
| Pittsburgh, PA | $222,075 | $231,278 | $104 | $1,248 |
| New Orleans, LA | $256,476 | $262,731 | $98 | $1,176 |
| Houston, TX | $304,116 | $307,199 | $94 | $1,128 |
| San Antonio, TX | $275,510 | $278,613 | $87 | $1,044 |
| Oklahoma City, OK | $241,627 | $246,398 | $86 | $1,032 |
| Memphis, TN | $241,179 | $245,565 | $84 | $1,008 |
Listings per buyer and months of supply
| Metro | Listings per buyer, last 4 wks | Listings per buyer, prior 4 wks | Months of supply, last 4 wks | Months of supply, prior 4 wks |
|---|---|---|---|---|
| United States | 21.3 | 20.7 | 3.0 | 2.9 |
| Hartford, CT | 5.7 | 6.9 | 1.0 | 1.2 |
| Richmond, VA | 7.5 | 6.8 | 1.3 | 1.2 |
| St. Louis, MO | 9.4 | 8.9 | 1.5 | 1.4 |
| Kansas City, MO | 9.6 | 9.1 | 1.5 | 1.5 |
| Chicago, IL | 9.6 | 9.3 | 1.5 | 1.5 |
| Cincinnati, OH | 9.8 | 8.8 | 1.6 | 1.4 |
| Boston, MA | 10.2 | 11.8 | 1.6 | 1.8 |
| Philadelphia, PA | 10.2 | 10.1 | 1.6 | 1.6 |
| Providence, RI | 10.6 | 11.8 | 1.7 | 1.8 |
| Milwaukee, WI | 11.1 | 11.3 | 1.7 | 1.8 |
| Columbus, OH | 11.1 | 10.7 | 1.7 | 1.7 |
| Baltimore, MD | 11.3 | 10.8 | 1.8 | 1.7 |
| San Francisco, CA | 11.4 | 11.3 | 1.8 | 1.8 |
| Minneapolis, MN | 11.8 | 12.0 | 1.8 | 1.9 |
| Cleveland, OH | 12.1 | 11.8 | 1.9 | 1.8 |
| San Jose, CA | 12.1 | 11.8 | 1.9 | 1.8 |
| Washington, DC | 12.5 | 11.3 | 1.9 | 1.8 |
| Buffalo, NY | 12.8 | 13.1 | 2.0 | 2.0 |
| Virginia Beach, VA | 13.0 | 12.9 | 2.0 | 2.0 |
| Detroit, MI | 13.2 | 11.9 | 2.0 | 1.9 |
| Louisville, KY | 13.2 | 12.8 | 2.0 | 2.0 |
| Pittsburgh, PA | 14.0 | 12.3 | 2.1 | 1.9 |
| Indianapolis, IN | 14.0 | 11.8 | 2.1 | 1.8 |
| Sacramento, CA | 15.6 | 15.5 | 2.3 | 2.3 |
| Salt Lake City, UT | 17.0 | 13.9 | 2.5 | 2.1 |
| Raleigh, NC | 17.7 | 17.5 | 2.6 | 2.6 |
| San Diego, CA | 17.7 | 17.0 | 2.6 | 2.5 |
| Birmingham, AL | 17.8 | 17.0 | 2.6 | 2.5 |
| Seattle, WA | 18.9 | 17.4 | 2.7 | 2.5 |
| Portland, OR | 19.6 | 18.6 | 2.8 | 2.7 |
| Los Angeles, CA | 20.5 | 20.2 | 2.9 | 2.9 |
| New York, NY | 20.8 | 22.6 | 3.0 | 3.2 |
| Nashville, TN | 22.3 | 19.8 | 3.1 | 2.8 |
| Oklahoma City, OK | 22.7 | 21.5 | 3.2 | 3.0 |
| Phoenix, AZ | 23.0 | 21.6 | 3.2 | 3.0 |
| Denver, CO | 23.2 | 20.3 | 3.2 | 2.9 |
| Memphis, TN | 24.7 | 19.3 | 3.4 | 2.8 |
| Charlotte, NC | 24.9 | 23.6 | 3.4 | 3.3 |
| Riverside, CA | 25.0 | 25.8 | 3.5 | 3.5 |
| Atlanta, GA | 27.6 | 23.5 | 3.7 | 3.3 |
| Tampa, FL | 27.7 | 26.4 | 3.8 | 3.6 |
| Jacksonville, FL | 27.9 | 26.4 | 3.8 | 3.6 |
| Las Vegas, NV | 29.2 | 28.6 | 3.9 | 3.9 |
| Dallas, TX | 30.8 | 28.3 | 4.1 | 3.8 |
| Orlando, FL | 33.2 | 32.7 | 4.4 | 4.3 |
| New Orleans, LA | 33.3 | 32.7 | 4.4 | 4.3 |
| Houston, TX | 39.3 | 37.6 | 5.0 | 4.9 |
| Miami, FL | 40.3 | 40.4 | 5.1 | 5.2 |
| Austin, TX | 43.6 | 39.8 | 5.5 | 5.1 |
| San Antonio, TX | 46.7 | 46.2 | 5.8 | 5.8 |