July 2026 Jobs Report Preview

Key takeaways
- The job market is frozen — low-hire, low-fire. Employers have sharply cut hiring without materially increasing layoffs; the market has stabilized at a cool level rather than actively deteriorating.
- June's 4.2% unemployment fell for the wrong reason. Participation dropped and about 500,000 fewer people were working — in the flows, an unemployed worker was about as likely to leave the labor force as to find a job.
- The growth is dangerously narrow. Strip out private education and health services and June's private payrolls actually fell. One sector carried the report.
- Expect an outsized market reaction. With inflation still elevated and a divided FOMC that just held 9–3, a hot print raises the odds of a September hike — and with forward guidance gone, the same data can move markets more than usual.
The job market is frozen: employers have sharply reduced hiring without substantially increasing layoffs. And the Fed is worried about inflation — it just held rates in a divided vote, with three officials wanting to hike. A near-term cut is no longer the base case. So Friday's report carries an unusual risk: a number that runs too hot could raise the probability of a rate hike and trigger another surge in Treasury yields, while a soft one simply validates the hold.
Most previews stop at the headline job count. We follow the flows — the odds a specific worker moves from unemployment into a job, or out of the labor force — because that's where the real temperature is.
What Wall Street expects Friday
Economists expect roughly 80,000 to 85,000 jobs, with unemployment near 4.2% (some see 4.3%) and average hourly earnings up about 0.3% — a modest rebound from June's +57k. The early tell isn't encouraging: ADP estimated that private payrolls rose by just 44,000 in July — below the Dow Jones consensus of roughly 75,000 and down from a revised 95,000 in June (its slowest since January, when it reported 22,000). ADP is not a reliable month-to-month predictor of the BLS report, but it reinforces the broader story of a cooling labor market. Let's build the picture chart by chart.
1 · The trend cooled, then flattened

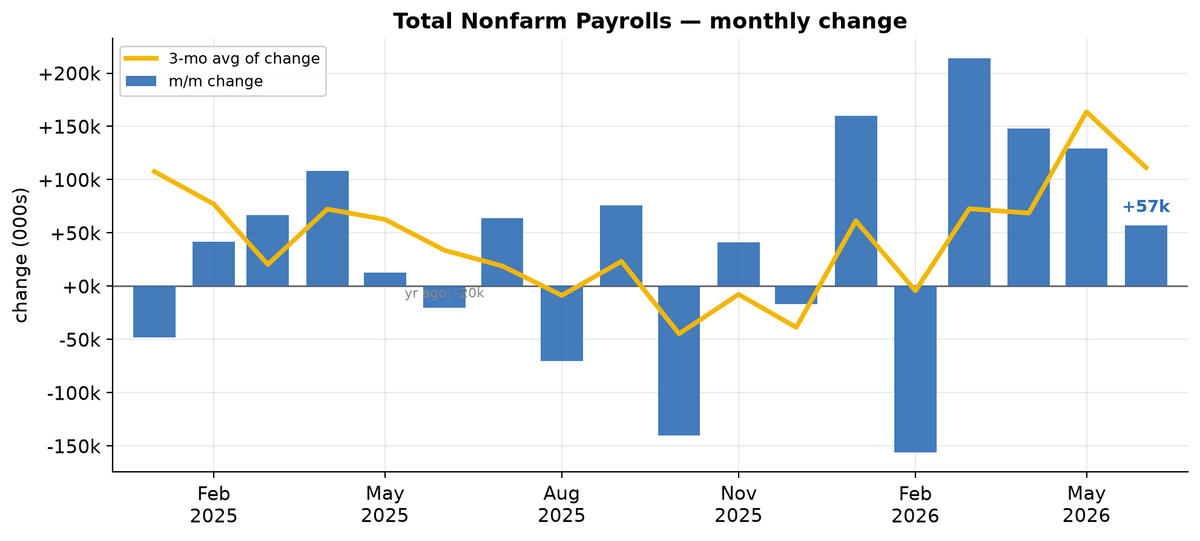
Two lessons. First, the monthly print is noise as much as signal — this series swung from −156k in February to +214k in March, so judge the trend, not the month. Second, the trend didn't fall off a cliff this year: after averaging just +15k a month in 2025, the pace firmed to about +92k in the first half of 2026 — below 2024's pace, but well above the depressed 2025 average in the current data vintage.
2 · Why "+57k" isn't as scary as it sounds
The economy needs fewer new jobs than it used to just to stand still. That "breakeven" number falls when the labor force grows slowly — and estimates have dropped sharply. Recent estimates often place the breakeven rate below 100,000 a month — down from well above that during the 2023–24 immigration surge — and one Federal Reserve estimate suggests it could be substantially lower in 2026. These figures are unusually uncertain, but the direction is clear: a "weak" +80k today can hold a line that +150k barely held two years ago. That's the charitable read. Now let's turn to the flows.
3 · The unemployment rate fell — for the wrong reason

Participation dropped three-tenths to 61.5% — the lowest since 2021 — and the household survey showed roughly 500,000 fewer people working. When someone stops looking, they stop being counted as unemployed, so the rate can fall even as opportunity shrinks. To see what's really happening, watch where the unemployed actually go.
4 · The flows: finding work, or leaving?

This picture isn't in the BLS summary. Two years ago the navy line — odds of landing a job — sat well above the gold line; they've now met. One important caveat: "left the labor force" is not the same as "gave up." That group includes retirement, school, caregiving and disability, and the Bureau of Labor Statistics count of discouraged workers was little changed, at about 477,000 in June. Still, the crossover signals weak labor-force attachment: the unemployment rate is easing partly because fewer people are actively searching, not because job-finding has strengthened.

5 · Low-hire, low-fire
Start with the reassuring half — the firing side. The JOLTS layoff-and-discharge rate held at 1.1% in June, and our employment-exit probability (the chance a worker moves from employment into unemployment) sits near 1.6% — below its 2018–19 average, though not a record low. Initial and continuing jobless claims also remain low, with no sustained sign of a broad rise in layoffs.

The other half is hiring, which has cooled and stalled. According to the Job Openings and Labor Turnover Survey (JOLTS), employers still made 5.3 million hires in June, but the pace has settled below its pre-pandemic norm. Quits — 3.2 million, a 2.0% rate versus the ~2.3% norm — gauge workers' willingness or ability to leave for something better; at these levels, mobility is subdued.


6 · Employment growth is dangerously narrow

Healthy expansions are broad. This one leans heavily on health care and education — sectors powered by aging demographics, insurance and steady demand more than by the business cycle. The cyclical corners are flat-to-shrinking: manufacturing +3k, financial activities flat, information −9k. Leisure and hospitality lost 61,000 as seasonal hiring came in weaker than usual; some payback in July is plausible, but not guaranteed.
7 · Pay is treading water — as inflation remains too high

Wage growth itself does not currently look excessive. Friday's earnings figure will still matter as one gauge of labor-market tightness, but the stronger argument for keeping hikes in play comes from persistent price inflation and rising short- and medium-term inflation expectations: the New York Fed's June survey put one-year expectations at 3.7% and three-year at 3.3%, though the five-year reading held at 3.0%.
So — improving or deteriorating?
Neither. It's frozen — stabilized at a low level.
Hiring cooled hard through 2024–25 and has plateaued: hires remain subdued, openings are roughly flat, the job-finding rate has shown no sustained improvement, and quits remain low. It's not sliding — it's stalled. Where there is deterioration, it shows up less in firing than in weaker hiring and softer labor-force attachment: falling participation, a sharp June drop in the household employment survey, and long-term unemployment up about 286,000 over the past year. Low-hire, low-fire — calm on the surface, cold underneath, with little cushion if demand weakens.
What comes next: how much to trust the early numbers
Rather than add our own guess, we scored the real-time trackers against the BLS actuals — each against the series it actually targets, and leaving out the pandemic, when every measure went haywire.
ADP vs. BLS private payrolls — the like-for-like comparison, since ADP measures private payrolls. Over roughly 181 months since 2010 (excluding 2020–21), ADP's average error is essentially zero (about −1,000), but it is a noisy point predictor: its mean absolute error is about 85,000, and it lands more than 50,000 off in 59% of months. What it does well is direction — whether hiring is speeding up or slowing — which it calls right about 80% of the time (scored as ADP and the BLS agreeing on the sign of the month-over-month change from the prior actual). (These figures use current, revised FRED data. A stricter real-time test would score each tracker's originally-published number against the BLS first print — the notebook supports that mode.)
Consensus and Revelio vs. BLS total nonfarm — the right benchmark for both, since they forecast total payrolls, not private. We've logged too few months so far to rank them fairly against total; the scorecard fills in as each report lands.
The soft 44,000 ADP estimate points down, while the roughly 83,000 consensus remains the market's anchor. Slowing employment growth coupled with stronger pay growth for job switchers could be a sign that slower labor-force growth is still holding the unemployment rate low — pointing to a tightening of labor-market conditions.
Why this report could cause higher-than-usual market volatility
On July 29 the Fed held at 3.50%–3.75%, but the vote was 9–3 — the most divided since 2016 — with three officials (Hammack, Kashkari, and Logan) dissenting in favor of a hike. Inflation has sat above the 2% target for over five years, new Chair Kevin Warsh calls it "a choice," and markets have moved from pricing cuts to pricing the risk of another increase. As of roughly 10 a.m. Eastern on August 5, CME FedWatch pricing implied a 58.9% probability of a September quarter-point increase — a figure that eased to about 57% later in the day. The debate has shifted from when to cut to whether the next move is a hike. That inverts the usual logic:
• A decline in the unemployment rate and an uptick in average hourly earnings would strengthen the dissenters' case and raise the odds of a hike at the next meeting.
• Any other report would justify the hold.
So look past the job count. With the labor market frozen and inflation still elevated, the unemployment rate and average hourly earnings will be the labor-market signals markets pay closest attention to.
There's a deeper reason Friday's report may move markets more than usual. The Fed held, but the bond market reacted sharply: the 30-year Treasury yield crossed 5.2%, its highest level since mid-2007. Warsh has deliberately reduced forward guidance, and he has acknowledged that the change may already be contributing to larger movements in market rates. He wants investors "playing the ball, not the referee."
No forward guidance and a lack of clarity about the Fed's near-term reaction function raises the chance that a surprise in payrolls, unemployment or wages produces a larger repricing than it would under a more clearly communicated policy path. Friday's test, then, isn't just the number — it's how aggressively markets translate that number into the odds of a September hike.
If you're hiring (small business)
Applicant availability has improved in many industries and turnover has fallen — though conditions vary a lot by occupation and location. Just remember borrowing costs may rise, not fall.
If you're looking for work
Budget more time than you expect, cast a wider net, and lean on people you know. The "quit Friday, start somewhere better Monday" era is over for now.
If you already have a job
Aggregate layoff indicators remain reassuring, but slower hiring means a comparable role may take longer to find if your situation changes — and don't count on cheaper credit arriving soon.
Data. Payrolls, JOLTS (hires, quits, layoffs, openings), the unemployment rate, and average hourly earnings come from the U.S. Bureau of Labor Statistics via FRED. Weekly jobless claims are from the U.S. Department of Labor. Inflation is the BLS Consumer Price Index (June 2026: headline 3.5%, core 2.6%). ADP figures are from the ADP National Employment Report (ADPMNUSNERSA on FRED, converted to thousands).
Flows and probabilities. The employment / unemployment / not-in-labor-force transition probabilities are computed from the BLS Current Population Survey gross labor-force flows. The job-finding and employment-exit probabilities follow Robert Shimer, "Reassessing the Ins and Outs of Unemployment," Review of Economic Dynamics 15(2), 2012 — an aggregate, assumption-based method that is not identical to the direct matched-person flows. In the tracker scorecard, "direction" is scored as agreement on the sign of the month-over-month change from the prior actual. Reference lines are each series' 2018–19 average. Flow and tracker calculations are in the accompanying notebook.
Fed. The FOMC held the target range at 3.50%–3.75% on July 29, 2026 by a 9–3 vote, with Presidents Hammack, Kashkari, and Logan preferring a quarter-point increase; the "inflation is a choice" characterization is Chair Warsh's. The wage assessment draws on the Federal Reserve's July 2026 Monetary Policy Report. Market pricing: CME FedWatch, reported by MarketWatch, approximately 10 a.m. ET, August 5, 2026.
June 2026 internals (BLS Employment Situation): participation 61.5%; household employment −507k; discouraged workers ≈477k (little changed); long-term unemployed +286k year-over-year; real average hourly earnings +0.1% year-over-year. Inflation expectations: Federal Reserve Bank of New York, Survey of Consumer Expectations (June 2026). Consensus figures: MarketWatch / Dow Jones / Reuters.
This is analysis, not investment advice.