Key Takeaways
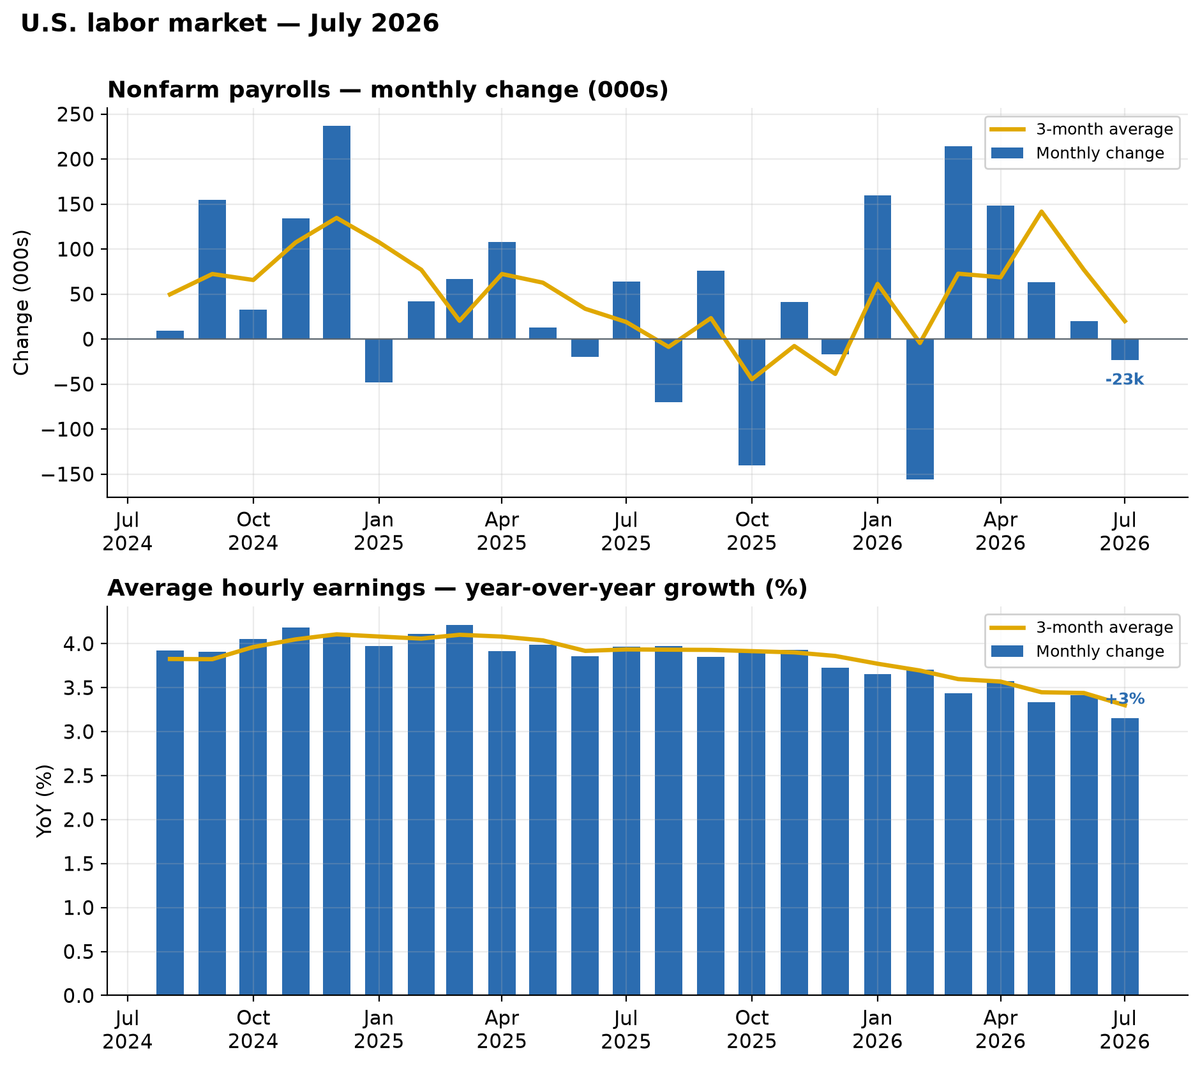
- Payrolls “fell” 23,000, but that is statistically indistinguishable from zero — and the drop was likely a government-education seasonal quirk. Private payrolls actually rose 30,000.
- The revisions are the story: May and June were cut by a combined 103,000, and the 12-month average is now just +34,000. The labor market didn’t stall in July — it has been stuck near stall speed for most of a year.
- Both sides of the market are capped: a shrinking labor force (fewer immigrants, lower native participation) on supply, and narrow, defensive payroll gains on demand.
- Wage growth eased to 3.2%. No re-acceleration — and with inflation elevated, this is the classic supply-shock bind for the Fed.
What Happened (Not Much)
Start with what didn’t happen. Payrolls changed by −23,000 — but the margin of error on that figure is large, so it is statistically no different from zero. The unemployment rate (4.1%), participation (61.4%), and the employment-population ratio (58.9%) each moved by a tenth of a point or less: roughly unchanged. Average hourly earnings rose two cents. On a single-month basis, this was a nothing report.
And the one number that looks alarming — the negative headline — appears to have been heavily influenced by seasonal effects. Local-government education employment fell 50,000, likely reflecting unusual school-calendar and seasonal-adjustment effects. Strip out government and private payrolls rose 30,000.
The Revisions Are the Story
The meaningful news sits at the back of the release. May was revised down 66,000 to +63,000, and June down 37,000 to +20,000 — 103,000 jobs erased between them. The three-month average is now +20,000, and the 12-month average has slipped to +34,000. Read together, the message isn’t that the job market suddenly broke in July. It’s that the first-half strength was never really there. The labor market didn’t accelerate this year — it has been grinding along near stall speed, much as it did for most of last year.
Where Payrolls Rose — and Fell
July’s payroll gains were concentrated in a few areas: health care and social assistance (+23,000), construction (+22,000), and professional and business services (+18,000). Losses were concentrated in leisure and hospitality (−40,000), retail trade (−19,000), and financial activities (−14,000). The broader picture remains narrow: health care continues to add jobs consistently, while much of the rest of the private economy is moving sideways.

The Supply Side Is Stuck Too
Growth needs workers, and the labor force is shrinking — down 264,000 in July, with participation at 61.4%, its lowest in more than five years and down 0.7 point since January. Part of that is fewer immigrants: the foreign-born labor force is down roughly 550,000 over the year. Part is soft native-born participation. With both the supply of workers and demand for them constrained, employment can’t grow much — but it isn’t collapsing either. Productivity can still support output growth, but the labor market itself is stuck in place.
Not in Wages
If the market were tightening, pay would show it. Instead, year-over-year earnings growth eased to 3.2% from 3.4%. There is no wage-price spiral here. And with headline PCE inflation at 3.7% in June, wage growth is no longer keeping pace with inflation.
What It Means for the Fed
This is classic supply-shock drama. Tariffs, oil (the Iran conflict still has energy prices elevated), and immigration limits all act like a tax: they push prices up while holding output down. The economy isn’t sputtering out of control — the labor market is just stuck, unable to grow as both the supply and demand sides are constrained.
That is the hardest setup for a central bank. Markets read the soft report as a green light — stocks rose, the 10-year yield fell toward 4.6%, and futures trimmed the odds of a September hike to about 44%. But the Fed is stuck: rate cuts can’t rebuild the labor force, and rate hikes would only restrain already-soft demand.
Numbers to Know
- Nonfarm payrolls: −23,000 (statistically ~unchanged); private +30,000
- Three-month average: +20,000 per month
- Revisions: May −66,000 to +63,000; June −37,000 to +20,000 (−103,000 combined)
- 12-month average: +34,000, down sharply
- Unemployment rate: 4.1%, roughly unchanged
- Labor force participation: 61.4%, lowest in 5+ years; −0.7 pt since January
- Employment-population ratio: 58.9%, roughly unchanged
- Labor force: −264,000 in July; foreign-born labor force down ~550,000 over the year
- Payrolls rose: health care +23k, construction +22k, business services +18k
- Payrolls fell: local gov. education −50k, leisure & hospitality −40k, retail −19k, financial −14k
- Average hourly earnings: +2 cents; +3.2% year over year, down from +3.4%
- Fed funds target: 3.50%–3.75% (held July 29 on a 9–3 vote, three dissents for a hike)
Bottom Line
This report changes nothing — more noise than signal. A labor market that neither broke nor healed, still stuck near the stall speed it has held for most of a year. Attention now turns to next week’s CPI, the real test of whether the supply-shock inflation the Fed fears is finally cooling.
Source: U.S. Bureau of Labor Statistics, Employment Situation — July 2026 (released August 7, 2026); FRED (St. Louis Fed); CME FedWatch. Nowcasts: Revelio Labs, LinkedIn.