The Consumer Is Treading Water: Retail Rose 5% Over the Year, but Two-Thirds Was Inflation

Key Takeaways
- A soft month, not a stalling one. Retail sales fell 0.58% in July—the first monthly decline in months—but the three-month trend is still growing at a +2.4% annualized pace.
- Most of the annual gain is just prices. Nominal sales are up 5.0% from a year ago, yet CPI-adjusted spending is up less than 2%, so roughly two-thirds of the “growth” is inflation rather than real growth.
- The weakness was narrow. Auto dealers and online sellers did nearly all the damage; restaurants, clothing, and general merchandise held up.
- The consumer is treading water. With inflation at 3.4% running ahead of 3.2% wage growth, real hourly earnings slipped—households are spending more dollars for less.
- Beneath the average, a K-shaped split. Higher-income households are spending above 2019 levels while lower-income households pull back, and trading down on stores (not just brands) has gone mainstream.
Americans spent $763.6 billion at retailers and restaurants in July, and for the first time in months, that was less than the month before — down 0.58% from June, seasonally adjusted, according to this morning’s Census Bureau report. A single soft month is rarely the story it first appears to be. But this one marks a turn worth understanding, because the strength is narrowing, the trend is cooling, and — most important — once you adjust for inflation, there is far less growth here than the headline suggests.
1. What happened: a monthly contraction inside a still-positive trend
July was a genuine monthly decline. What hasn’t declined is the recent trend. Annualize the one-month drop and you get −6.8%, alarming in isolation. But the three-month annualized pace, which smooths out the monthly noise, is still +2.4%, and sales are up 5.0% from a year ago. So the accurate framing is a monthly contraction sitting inside a trend that is still growing — cooling, not cracking.
The weakness was also concentrated. Two categories did nearly all the damage: auto dealers (−1.8% on the month) and nonstore retailers — mostly online sellers — which fell 2.3%. As with every line in the advance report, those figures are subject to revision. Outside those two, the picture was steadier: restaurants and bars rose 0.5%, clothing jumped 1.9%, and building materials, general merchandise, and health-and-personal-care all edged up.
Now adjust for inflation — the step that gives us a better read on how much of the increase in spending reflects higher prices rather than more purchasing. Using seasonally adjusted CPI-U as the deflator, CPI-adjusted retail sales fell about 0.7% on the month and are up only about 1.7% from a year ago. The core measure I describe below is up a slimmer 1.1% in real terms. Headline CPI itself rose 0.1% in July and 3.4% over the year.
Put those numbers together and you get the sentence that matters: nominal spending grew 5.0% over the year, but on this CPI-adjusted measure, roughly two-thirds of that growth reflects inflation rather than real growth. The gasoline line is the cleanest illustration. Gas-station sales are up 16% from a year ago in dollars, while gasoline prices are up nearly 25%. In fact, gas-station sales have been falling over the past three months. Take the report at face value and you’d think gasoline was booming. It isn’t; it’s a price story, not a volume boom.
2. What it means for the consumer, the Fed, and growth
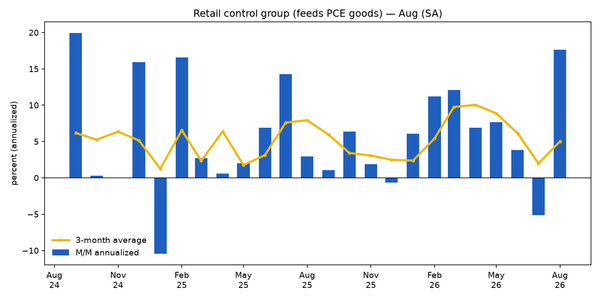
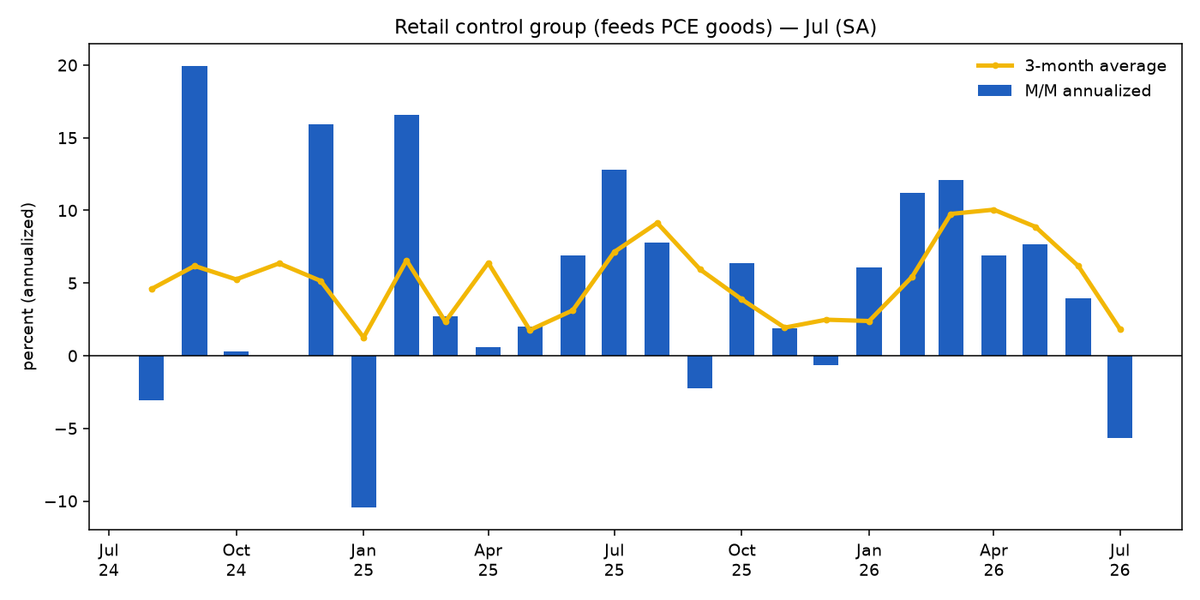
For the broader economy, the number to watch is the retail control group — total sales stripped of autos, gas, building materials, and restaurants. It’s widely followed because it closely tracks the retail inputs the Bureau of Economic Analysis uses to build much of its estimate of consumer goods spending. It fell 0.48% in July and is up just 1.1% in CPI-adjusted terms over the year — modest, still-positive goods spending, with restaurants — the principal service category captured in this report — running notably firmer at a 9% three-month annualized pace. BEA uses the retail-control method to estimate most PCE goods categories.
The consumer underneath these numbers is running on a treadmill and holding up. Inflation, at 3.4%, is again running slightly ahead of wages: average hourly earnings rose 3.2% over the year, leaving real hourly earnings down about 0.2%. Spending is holding up in dollars, but households are getting a little less for each of them. People aren’t pulling back so much as treading water.
For the Federal Reserve, the report lands in an uncomfortable spot. This isn’t the usual story of a cooling economy handing the Fed room to cut. Inflation remains above target, while the energy shock is keeping headline inflation elevated, and the market is debating whether the Fed’s mid-September meeting brings a rate hike, not a cut. A softening consumer is what the doves would point to for holding steady; inflation still above target is what keeps the hawks in the room. The practical read: today’s data cools the growth side of the Fed’s dilemma without settling the inflation side. The soft retail report has added to expectations that the Fed will hold in September rather than hike. And policymakers still get several more data points — another jobs report and fresh CPI, PPI, and PCE inflation readings — before they decide. July PCE is scheduled for August 26.
3. The state-by-state question: not in this report
A natural follow-up is whether the slowdown is broad or regional. This report can’t answer that: the monthly retail release is national only, with no state breakdown.
State-level retail does exist, but from a separate, experimental Census product: Monthly State Retail Sales (MSRS), a modeled series that blends the survey with administrative and third-party data. Two caveats before leaning on it. First, it reports only year-over-year percent changes, so “acceleration” has to be inferred from whether a state’s annual growth rate is rising or falling. Second, it runs roughly three months behind the national number. For a timely state read, MSRS is the Census product designed for monthly state-level comparisons, but it will always describe where the consumer was, not where they are today. The next scheduled release, on August 20, covers May.
4. Beneath the average: a K-shaped consumer turning to value
The most important thing this report doesn’t show is who is doing the spending — and that’s where private-panel data, like Numerator’s, earns its place. The two sources do different jobs. Census is the official scorecard: a representative survey of what retailers ring up, in dollars, feeding into GDP. Numerator is a consumer purchase panel built from receipts, so it can see what Census can’t — income tier, brand versus store brand, units versus dollars. Use Census for how much; use Numerator for who and what.
And what it shows is a consumer splitting in two. Numerator’s own research describes a bifurcating, K-shaped economy: higher-income households have grown their inflation-adjusted base spending about 6% above 2019 levels, while lower-income households have seen theirs decline outright as financial stress builds. The averages in the Census report are the blended result of those two diverging lines.
The trading-down behavior has also evolved in a telling way. Consumers used to trade down on brands — swapping the name brand for the cheaper one. Increasingly, per consumer-sentiment work from Alvarez & Marsal, they’re trading down on retailers — keeping the brand but switching to a cheaper store, a share that rose to 27% from 16% a season earlier. And the shift to private label is no longer just a budget-shopper story: 68% of consumers say store-brand quality matches or beats national brands, and that view spans income groups. Value isn’t a discount phenomenon anymore; it’s the whole market.
So, to the questions we set out to answer: yes, the high end is trading down — but through where they shop and which labels they buy, not by spending less overall. And no, there’s no clean sign yet that the bottom has rebounded; the low-income cohort is where the strain still shows. The value migration is broad, and it looks structural rather than temporary.
The bottom line
July was a soft month, not a stalling one — but the softness is more telling once you strip out prices. Nominal spending rose 5%; CPI-adjusted spending is up less than 2% and lost ground in July. The consumer in aggregate is treading water, and beneath the average, the water is a lot deeper for some households than others. That divide, more than any single month’s print, is the story worth watching.
A note on method and sources
Retail figures are seasonally adjusted, from the U.S. Census Bureau’s Advance Monthly Retail Trade Survey (July 2026 advance, released August 14, 2026). One-month annualized = (1 + monthly change)^12 − 1; three-month annualized = (level ÷ level three months prior)^4 − 1. Real figures deflate the nominal dollar series by CPI-U (all items, seasonally adjusted). A goods-only deflator (CPI commodities), with gasoline deflated separately, would be a tighter match to retail’s basket and is the natural refinement.
- U.S. Census Bureau — Advance Monthly Retail Trade Survey
- U.S. Census Bureau — Monthly State Retail Sales
- U.S. Bureau of Labor Statistics — Consumer Price Index, July 2026
- U.S. Bureau of Labor Statistics — Real Earnings, July 2026
- U.S. Bureau of Economic Analysis — Retail control method
- Numerator — Visions: Consumer Trends for 2026
- Alvarez & Marsal — Consumer Sentiment Survey, Spring 2026