July's Inflation Looked OK. Here's Why It Might Not Last

July inflation was genuinely benign — services cooled and annual shelter inflation kept easing. But underneath the friendly headline are three forward-looking risks: rent disinflation looks like it may be bottoming, July’s oil jump hasn’t yet reached consumer prices, and more tariff pass-through is still in the pipeline.
Key Takeaways
- A benign headline. Consumer prices rose just 0.1% in July and the annual rate eased to 3.4%, with the stickiest piece — core services — finally cooling.
- The oil rebound hasn’t yet reached consumer prices. Energy prices fell again even as crude spiked in late July. July's oil shock was only partly reflected in consumer energy prices, leaving a clear upside risk for August.
- Tariff pass-through is still in the pipeline. Nearly half of surveyed firms still expect further tariff-driven price increases.
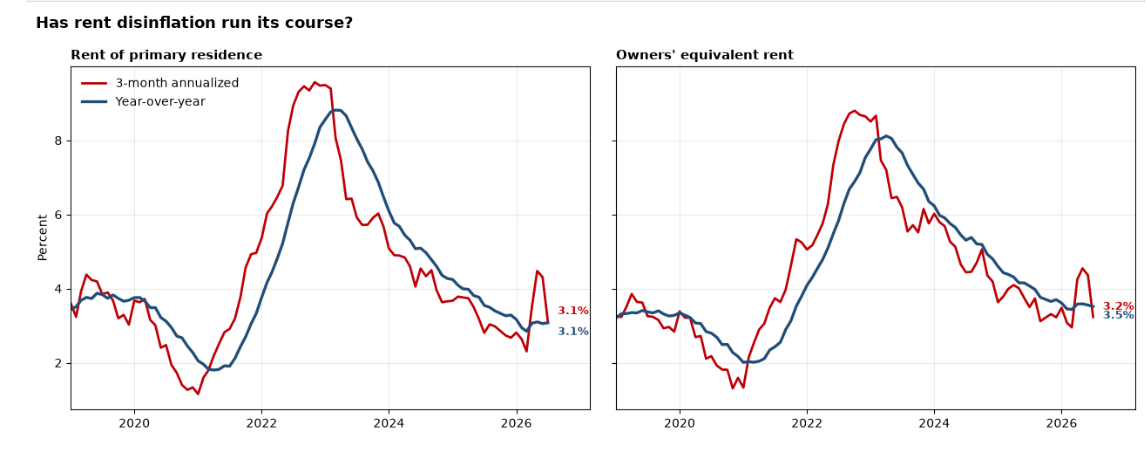
- Rent may be bottoming. Three-month annualized rent growth has climbed back to its year-over-year pace, an early sign the two-year housing disinflation is nearing its floor.
What happened — and how the bond market reacted
On the numbers, this was the report markets wanted. Headline prices rose 0.1% for the month, trimming the annual rate to 3.4% from 3.5%. Core — stripping out food and energy — rose 0.2%, easing to 2.5% from 2.6%. Both were in line with the Wall Street consensus. That makes July the second straight monthly decline in the annual rate, after a genuinely ugly spring: headline inflation ran 3.3% in March, 3.8% in April and 4.2% in May as the Iran conflict pushed oil higher, before June and July walked it back.
The detail is where the story lives:
Energy fell again — and probably shouldn’t have for much longer. The energy index dropped 1.5% on the month, gasoline 2.9%. That looks odd next to a July in which Brent crude ran from about $71 a barrel to above $100 by the 23rd — but pump prices lag the barrel by weeks, and drivers still paid an average of about $4.06 a gallon last month. July’s gasoline relief is unlikely to persist; it’s a clear upside risk for the August number. Over the past year energy is already up 14.7%, gasoline 24.6% — a reminder of how far prices have climbed.
Goods rebounded, but one month isn’t a trend. Core goods rose 0.2% after two straight monthly declines. Read carefully: the three-month annualized pace for core goods is essentially zero, so this is a bounce, not a confirmed turn. The reason to watch it is tariffs — the New York Fed finds 47% of tariff-paying service firms and 44% of manufacturers still expect further tariff-driven price increases.
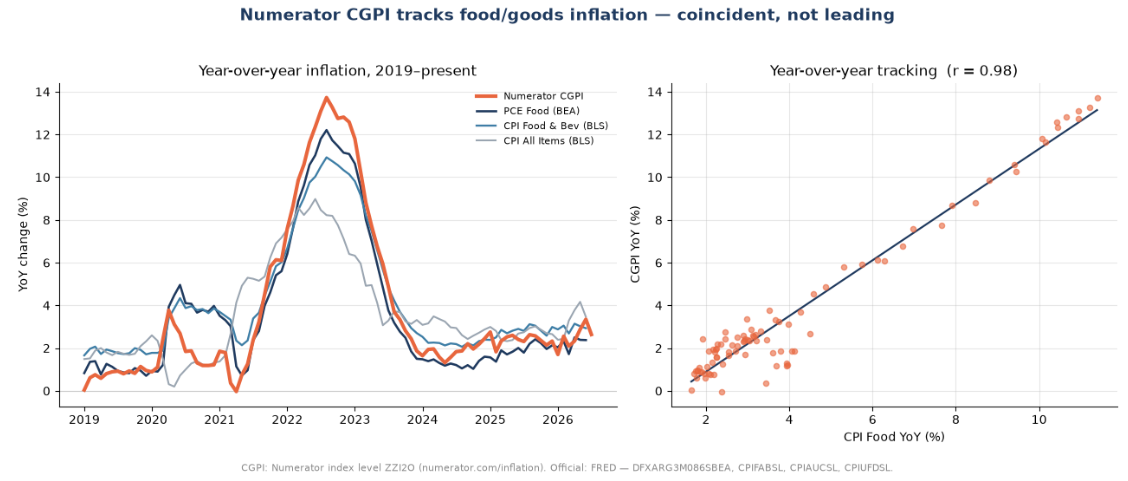
The grocery aisle, on the other hand, is cooling. Food at home slipped 0.1% on the month and eased to 2.7% year-over-year. That lines up with a private advance gauge — Numerator’s Consumer Goods Price Index, built from millions of verified household purchases, which showed the prices it tracks were down 0.4% in July and annual inflation cooling to 2.6% from 3.4%. The CGPI tracks official food inflation closely, so it’s useful corroboration that the food side is genuinely softening.
The momentum read is even softer than the annual numbers. Strip out the year-ago base effects and look at the last three months annualized: headline is running about 0.5% and core about 1.6% — both well below their year-over-year pace. But look at what is holding it down. Energy has been subtracting at roughly a 13% annualized clip over those three months; that single line is most of the reason the headline looks so tame, and it’s exactly the piece that could reverse. The more durable good news is that core services momentum has cooled to about 2.2% annualized, down from a 3.0% yearly pace — the stickiest part of inflation is finally giving.
The bond market’s verdict. Coming in, this was that rare report where the risk was a hike, not a cut: the Fed has held at 3.50–3.75% all year, three officials dissented in July in favor of raising, and markets put September hike odds near 46%. An in-line print took some of the urgency out of that — hike odds slipped to around 42% afterward.
Shelter barely moved — and may have bottomed
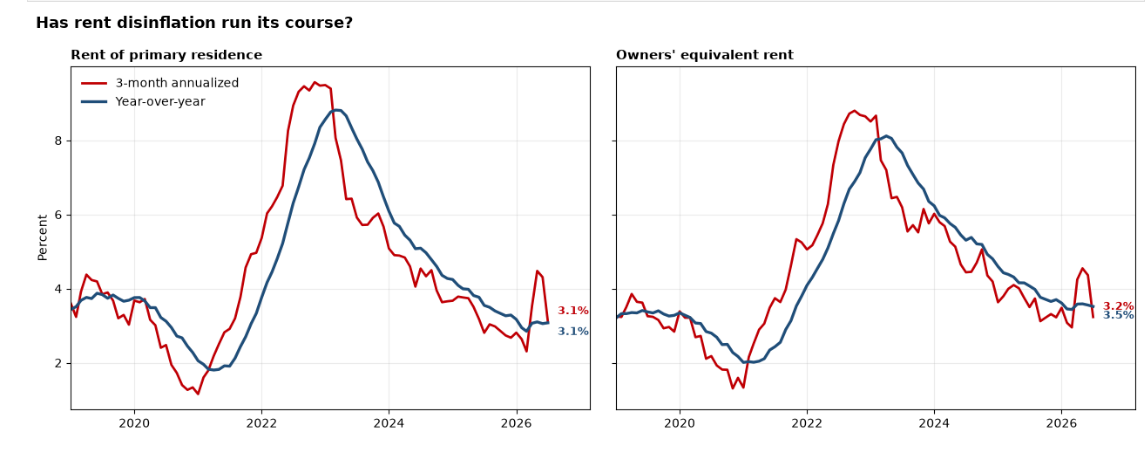
Shelter is the biggest, stickiest line in the whole index, and it has done most of the disinflation heavy-lifting for two years. In July it barely eased: it rose 0.1% — the same as June. The headline shelter figure was flattered by a 2.8% drop in hotel prices; the pieces that matter for the trend went the other way. Rent of primary residence accelerated to 0.26% on the month (from 0.15% in June), and owners’ equivalent rent to 0.26% (from 0.24%).
That’s why the more interesting signal is momentum, not the annual rate. Rent of primary residence is up 2.9% over the past year — but its three-month annualized pace is 3.1%, running above the yearly figure. When the recent run-rate climbs back over the trailing year, it’s an early warning that a disinflation may be nearing its floor. Owners’ equivalent rent is less conclusive — about 3.2% on both measures — so this is a signal to watch, not a confirmed inflection. It fits what leading data already showed since the start of the year: Zillow’s observed asking-rent growth has firmed from 1.9% year-over-year in February to 2.2% in June, and Zillow expects rental conditions to gradually tighten as new supply is absorbed.
Inflation runs higher where housing supply is most constrained
Inflation isn’t one number — it depends on where you live. Ranked by the past year, the Northeast is hottest at +4.1%, followed by the Midwest (+3.5%) and the South (+3.2%), with the West coolest at +3.0%. Among the big metros that report monthly, New York leads at +4.6%, then Los Angeles (+3.4%) and Chicago (+2.5%).
Housing appears to be an important part of that spread: rent inflation has been running far hotter in the Northeast and Midwest than in the South and West.
What it means for consumers and the Fed
For your wallet. Prices are up 3.4% over the past year; average hourly earnings grew about 3.2% — so real hourly wages have fallen (down about 0.2% over the year). The squeeze is mild, but it’s a squeeze.
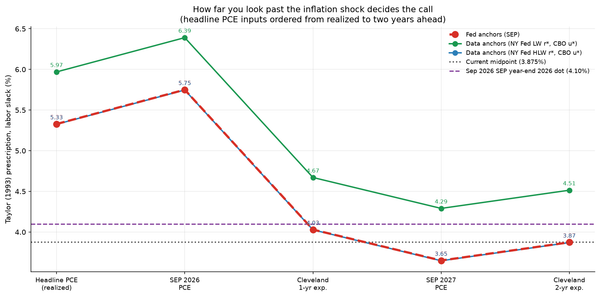
For the Fed. Core CPI remains elevated at 2.5% — though note the Fed’s 2% target is defined on PCE, a different index that typically runs cooler. This report buys a little breathing room but settles nothing. It softened the case for an imminent September hike, yet the live debate is still hike-versus-hold, not cuts: three officials already voted to raise in July, and Cleveland Fed President Beth Hammack wrote after the July meeting that “now is the time to act.” The Fed gets one more inflation report — August CPI, out September 11 — before its September 16 decision.
Bottom line. July was genuinely benign, and some of the progress is real: core services have cooled substantially. But housing inflation may no longer be helping, July’s oil rebound hasn’t yet reached consumer prices, and more tariff pass-through is still working through supply chains. Enjoy the calm — the pass-through is still a risk that lies ahead.