Construction spending dragged down by factories and housing, and remodeling tracks housing wealth

Key Takeaways
- Construction spending is shrinking, led by factories and housing. Total spending fell 1.9% (±0.7%) in September and is 2.9% (±1.0%) below the same nine months of 2025. Factory and housing construction have each fallen by more than $30 billion this year, while data centers and power grow; Housing also continues to weigh down construction spending. Higher mortgage rates are hitting single-family first, with permits at their lowest since March 2023; multifamily is holding up better.
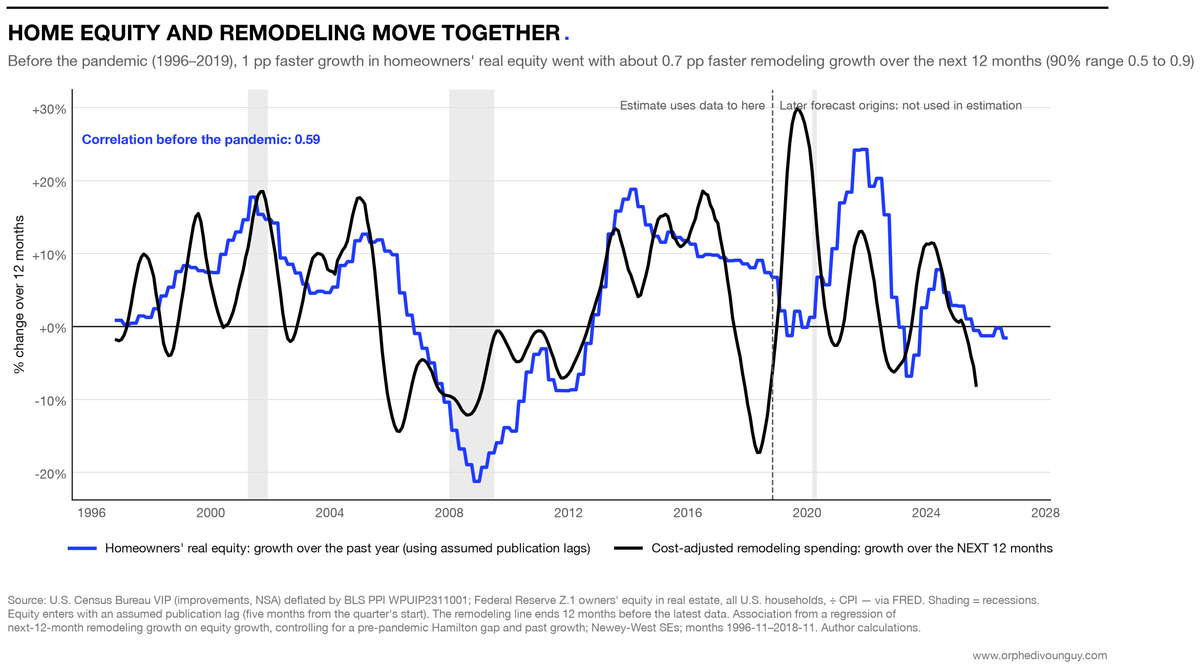
- Remodeling is below trend, and it tracks homeowners’ wealth. Cost-adjusted home-improvement spending is running at about $387 billion a year, down 8% over the past year and roughly 9–11% below its long-run trend. Of more than a dozen indicators tested, home prices and home equity were the best early signals; mortgage rates, jobs, incomes, stock prices and worker turnover added little to the forecasts.
- Our central estimate: stabilization, not a rebound. Housing-wealth indicators point to about $393 billion of cost-adjusted remodeling over the next 12 months (+1.5%), below remodeling’s long-run average growth of 2.8% a year and still about $32 billion below the March 2026 peak.
The news: construction spending is down for the year
Construction spending fell 1.9% in September to a $2,186.1 billion seasonally adjusted annual rate. Part of the drop reverses August, which was revised up to a 2.0% gain, but the bigger picture is a contraction. Spending is 2.7% below September 2025. Year-to-date, comparing January–September 2026 with the same nine months of 2025, it is down 2.9%: $1,649.6 billion versus $1,698.6 billion. Comparing the same months each year removes seasonal swings.
The decline comes from private construction. Private construction is down 4.1% this year; public construction is up slightly (1.1%).
The money is moving from homes and factories to data centers and power:
| Category | Jan–Sep 2026, $ billions | Change vs. Jan–Sep 2025, $ billions | Change, % (±90% margin) |
|---|---|---|---|
| Residential (private) | 671.3 | −31.8 | −4.5% (±2.1%) |
| Manufacturing | 130.4 | −35.3 | −21.3% (±1.5%) |
| Commercial | 92.5 | −5.3 | −5.4% (±2.6%) |
| Power | 136.1 | +7.5 | +5.9% (±0.8%) |
| Office (includes data centers) | 103.7 | +13.1 | +14.5% (±2.3%) |
| Total construction | 1,649.6 | −49.0 | −2.9% (±1.0%) |
Source: U.S. Census Bureau, Construction Spending, September 2026, Tables 2 and 3. Not seasonally adjusted.
Data centers, which Census counts inside private office construction, are up 49.1% this year to $54.2 billion and now make up 59% of private office spending; general office is down 10.6% (see our July analysis). Factory construction keeps unwinding: the Census computer/electronic/electrical category is down 45.0%.
For the housing industry, the headline is simpler: residential construction is the largest category and is shrinking. The rest of this piece is about why, and what comes next.
New housing: higher rates bite first
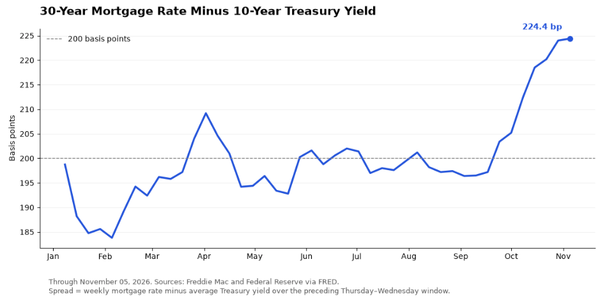
Borrowing costs moved the wrong way this fall. The 30-year fixed mortgage rate averaged 7.24% in the week of October 29, down from a 7.40% peak earlier in the month but about a point above the 6.17% of a year earlier. The 10-year Treasury yield, which mortgage rates follow, is up about three-quarters of a point since the end of 2025.
For a buyer, that point is real money. On a $320,000 loan (80% of September’s $400,400 median new-home price), the monthly principal and interest payment rises from about $1,960 at 6.17% to about $2,180 at 7.24%: roughly $230 a month, or $2,700 a year, for the same house.
Single-family is pulling back. Spending on new single-family homes is down 4.8% (±3.8%) this year, about $15.5 billion less than in January–September 2025. The pipeline points to more of the same. Single-family permits fell 4.0% in September to an 845,000 annual rate, the lowest since March 2023, and single-family starts fell 4.6% to 859,000. Through September, single-family permits are down 2.8% and starts 4.0% from the same months of 2025. Builders are also sitting on about 150,000 approved-but-unstarted single-family homes, roughly two months of recent permits versus about one and a quarter months in 2019. Builder sentiment in October was the weakest since June 2012 and new-home sales ran at a 676,000 annual rate in September, 5.3% below a year earlier.
Multifamily is holding up better. Multifamily construction spending is essentially unchanged this year (−0.3%, ±5.3%). The earlier stages of the pipeline are moving the other way from single-family: through September, multifamily permits are up 3.7% and starts up 5.5% from the same months of 2025, and multifamily permits rose 6.1% in September alone to a 555,000 annual rate. Monthly numbers are volatile, though: starts of buildings with five or more units were 25.9% below a year earlier in September. Completions are the weak spot, down about 20% from a year earlier for larger buildings, so less new supply is arriving now even as more is getting started.
The drag shows up in GDP too. Real residential investment fell at a 3.3% annual rate in the third quarter and subtracted 0.1 percentage point from growth.
Remodeling: below trend after a hard year
Home-improvement spending is down about 5.5% this year, roughly $16 billion less than in January–September 2025: about half of the decline in private residential spending, the same size as the hit to new single-family construction.
A note on what this measures. Census doesn’t publish improvements as a separate line, so we derive it as private residential spending minus new single-family and new multifamily. It covers remodeling, additions and major replacements on owner-occupied homes; it excludes routine maintenance and repairs and work on rental properties. It’s also among the noisiest series Census publishes: improvements fell about 13% in September alone, a number we wouldn’t lean on. Below, we use the annual pace (spending over the past 12 months), which smooths the noise and the seasons.
On that basis, cost-adjusted remodeling is running at about $387 billion a year, down about 8% from a year earlier and from a peak of $425 billion in March 2026. Over the long run this spending grows about 2.6% a year after costs. Measured against that trend, it is now roughly 9–11% below normal, in the bottom fifth of its history. One caveat on “cost-adjusted”: the adjustment uses the producer price index for residential construction materials, which leaves out labor and contractor margins, so the level and the size of the gap depend on that choice.

What predicts remodeling: homeowners’ wealth
To find out which indicators help predict remodeling, we tested more than a dozen against remodeling data going back to the 1990s, grouped into housing (home prices, new-home sales, mortgage rates), household finances (home equity, home-equity borrowing, debt payments, savings, consumer sentiment) and the broader economy (jobs, income, building-materials sales, stock wealth). The test for each: on its own, does it forecast remodeling growth over the next year better than simply assuming its historical average?
Housing wealth performs best. Home prices and home equity were the strongest individual forecasters, each reducing typical forecast errors by about one-fifth relative to the historical-average benchmark; new-home sales came next. Before the pandemic (1996–2019), each extra percentage point of growth in homeowners’ real (after-inflation) equity went with about 0.7 point faster remodeling growth over the following 12 months, with a 90% range of about 0.5 to 0.9. It makes economic sense: equity is both the collateral for home-equity loans and the cushion that makes owners comfortable investing in their homes.
Most of the usual suspects added little. On their own, changes in mortgage rates, jobs, incomes, stock wealth and consumer sentiment forecast remodeling no better than its historical average, and several did worse. That doesn’t mean they have no economic effect, only that they didn’t improve these forecasts.
What about people moving less? Some analysts argue that fewer moves won’t sink remodeling because the market has shifted toward improving in place. We tested two kinds of turnover. Job turnover (hires plus separations) didn’t improve the forecasts. Housing turnover, measured by home sales since 2008, also added little once housing wealth was included, though the sample is short. Neither test settles the improve-in-place question. Over time, the relationship with home sales weakened in the 2010s and has strengthened in more recent estimates; the equity relationship has weakened, although formal tests don’t show a clear structural break.
One idea that didn’t hold up. We also tested whether today’s high mortgage rates are “locking up” equity, making it less useful for funding projects because owners won’t refinance away their low rates. During the pandemic years, the data seemed to say yes; excluding them, the effect is small and not statistically meaningful. And our lock-in proxy, the current mortgage rate minus its trailing seven-year average, is about 1.8 percentage points, roughly twice its pre-pandemic maximum, so history can’t settle it. Housing wealth matters; the lock-in story alone isn’t established.
The forecast: stabilization, not a rebound
We built a simple forecast from four housing-wealth indicators (real home prices, real home equity, real home-equity line balances and new-home sales) and backtested it: at each month since 2008, we re-estimated it using only outcomes already known, with indicators entering after assumed publication lags designed to approximate when they became available, and compared it with the simplest alternative, a forecast of remodeling’s historical average growth. The backtest uses today’s revised data rather than the numbers available at the time.
It works, with limits. Leaving out the pandemic years, the housing-wealth forecasts beat the historical-average forecast, and the advantage is statistically significant at the 10% level across the tests used, although not consistently at the stricter 5% level. In one forecast a year, the typical error was about 19% smaller, and the forecast called the direction (above or below average) right in 11 of the 13 years tested. It is best at seeing turns coming: it flagged the 2008–2011 decline while the historical average kept expecting growth. The advantage is smaller when the evaluation begins in 2009, excluding the earliest financial-crisis forecasts. And it is weaker on size: it called the 2013–2017 boom as above average but well short of its actual strength, and it missed the 2018–19 drop.

What it says now:
| Growth, next 12 months (cost-adjusted) | Annual spending | |
|---|---|---|
| Housing-wealth forecast (central estimate) | +1.5% | $393 billion |
| Today (Sept. 2026) | — | $387 billion |
| Range of past forecast misses | −13.5% to +13.2% | $335 billion to $438 billion |
| Long-run average growth | +2.8% | $398 billion |
Dollars are in September 2026 costs. The range spans the 5th to 95th percentile of the model’s past forecast errors, excluding the pandemic years; it is a guide to uncertainty, not a guaranteed 90% interval. Long-run average = average log growth since 1994, converted to an ordinary percentage change.
In plain terms: we forecast that the slide stops but growth in 2027 trails its long-run average. The reason is homeowners’ wealth: after inflation, home prices are down about 1.3% over the past year and home equity about 1.6% (as of the latest data, for the second quarter), and both pull down remodeling spending. Home-equity borrowing is growing at its usual pace, and new-home sales are a slight drag.

Stabilization, not a rebound. A 1.5% gain would lift spending to about $393 billion over the 12 months to September 2027, still about $32 billion below its March 2026 peak of $425 billion. Because remodeling’s long-run trend grows about 2.6% a year, faster than the forecast, spending would end that period about 10% below trend, roughly where it is today. The forecast covers the 12-month total, not the month when spending bottoms. A true rebound would need what has preceded past recoveries: real home prices and home equity growing again.
A year ago, the same approach said the coming year would be below average, and it was, though the actual decline (about −8%) was far larger than the forecast.
What it means
Homebuilders: Expect a soft winter for single-family. Permits are at a three-and-a-half-year low, mortgage rates are above 7%, new-home sales are below last year and expected to remain below what we’ve seen in recent year. A sustained decline in mortgage rates would be the first sign that permits can recover.
Housing providers: Multifamily is not in the same retreat as single-family. Permits and starts are up this year, but completions are down sharply, so new supply competing for renters is thinning now and should pick up again as this year’s starts are finished late in 2027 and 2028.
Remodelers: Watch homeowners’ wealth more than the jobs report or even the ‘rate-lock’ effect. Home prices and equity have been the best early signals of where remodeling is headed, and right now they point to a flat year at roughly $393 billion in cost-adjusted spending, below the long-run average and short of a recovery. When real home prices have started rising again, remodeling has typically followed within the year.
The bottom line
Construction spending is shrinking because housing and factories are contracting faster than data centers and power are growing. For the housing industry, higher rates are already visible in new construction. Remodeling is a different story: among the indicators tested, homeowners’ wealth has been a better guide than rates, jobs or housing turnover. With real home prices and equity slightly down, our central estimate is that remodeling stabilizes over the next year rather than rebounds.
Sources: U.S. Census Bureau, Construction Spending, September 2026 (CB26-176), Tables 1–3, and private construction detail. Census/HUD New Residential Construction, September 2026, as analyzed in my housing starts write-up. Year-to-date figures are not seasonally adjusted; monthly figures are seasonally adjusted annual rates; margins of error are 90% confidence intervals from Census Table 3. Census, New Residential Sales, September 2026. Freddie Mac, Primary Mortgage Market Survey. Reuters via Arizona Daily Star, builder sentiment. U.S. Treasury, Economy Statement, November 2, 2026. John Burns Research and Consulting.
Method (author calculations): Improvements = Census private residential minus new single-family and new multifamily (not seasonally adjusted; owner-occupied properties, which Census applies consistently back to 1993), cost-adjusted with the BLS producer price index for residential construction inputs (materials only; excludes labor and margins) and summed over 12 months. Recent months are subject to large revisions. Trend and cycle: Hamilton (2018) regression filter, with the Hodrick–Prescott filter as a check. Indicators (via FRED): S&P CoreLogic Case-Shiller home prices and Federal Reserve owners’ equity in real estate, each divided by CPI; Federal Reserve home-equity line balances; Census/HUD new-home sales; plus mortgage rates, JOLTS hires and separations, payrolls, real income, savings, debt service, consumer sentiment, building-materials sales, household stock wealth and Zillow home sales. Indicators enter with assumed publication lags designed to approximate when they became available; the backtest uses today’s revised historical data. Models use log changes; reported figures are converted to ordinary percentage changes. Equity association: regression of next-12-month remodeling growth on past-year real equity growth, controlling for a pre-pandemic trend gap and past growth, forecast months November 1996–November 2018; Newey–West standard errors. Forecasts: average of single-indicator regressions, re-estimated each month (expanding-window backtest on revised data), scored against the average log growth of all earlier years (the long-run benchmark is average log growth since 1994, converted to an ordinary percentage change), excluding forecasts whose window touches December 2019–December 2022; significance by Diebold–Mariano tests with 11-, 23- and 35-month bandwidths and a 24-month block bootstrap.