The Fed Paused as Expected. So, What’s Up With the Bond Market’s Reaction?

Key Takeaways
- The Fed paused, but financial markets continued to tighten. Short-term Treasury yields fell while longer-term yields rose, steepening the yield curve. Investors still expect additional rate hikes, but long-term borrowing costs can rise even without Fed action.
- Higher long-term yields weren’t just about inflation. Real yields accounted for half of Wednesday’s six-basis-point increase in the ten-year Treasury yield and roughly 71% of the increase at thirty years. Higher inflation compensation contributed too, but stronger growth expectations and risk premiums may also be playing a role.
- The Fed is betting inflation will cool. That’s increasingly risky. September PCE inflation climbed to 3.6%. A standard Taylor rule using that figure calls for a policy rate near 5.6%, well above today’s 3.75%–4.00% range. If inflation and inflation expectations continue rising, the Fed may need to tighten more aggressively later.
The Federal Reserve held interest rates steady Wednesday, but the bond market delivered a more complicated message. Short-term Treasury yields fell while longer-term yields rose, steepening the yield curve.
The increase in long-term yields reflected both higher inflation-adjusted interest rates and greater inflation compensation. But the Fed wasn’t the only force moving bond markets. Rising oil prices and concerns about inflation also influenced trading.
That’s important because borrowing costs can rise even when the Fed leaves its benchmark rate unchanged.
1. What happened?
The Fed maintained its benchmark rate at 3.75%–4.00%, following September’s quarter-point increase. The decision passed 10–2. Lisa Cook and Beth Hammack dissented, preferring another quarter-point hike.
The majority wants more information before deciding whether additional tightening is necessary. The dissenters believe there’s already enough evidence to act.
The Fed described economic growth as strong, domestic spending as resilient, productivity growth as strong, and capital investment as robust. Inflation, however, remains elevated.
Why is the Fed willing to go slow? Likely because monetary policy operates with long and variable lags, and the Fed needs ‘additional information’ about the impact of September’s rate hike.
2. The market reaction: The yield curve steepened
The decision was largely expected. But Treasury yields moved differently before and after the announcement.
Ahead of the decision, yields were rising across the curve. Just before the 2:00 p.m. ET announcement, the ten-year Treasury yield had already climbed above 5% (5.02%), while the two-year yield approached 4.77%.
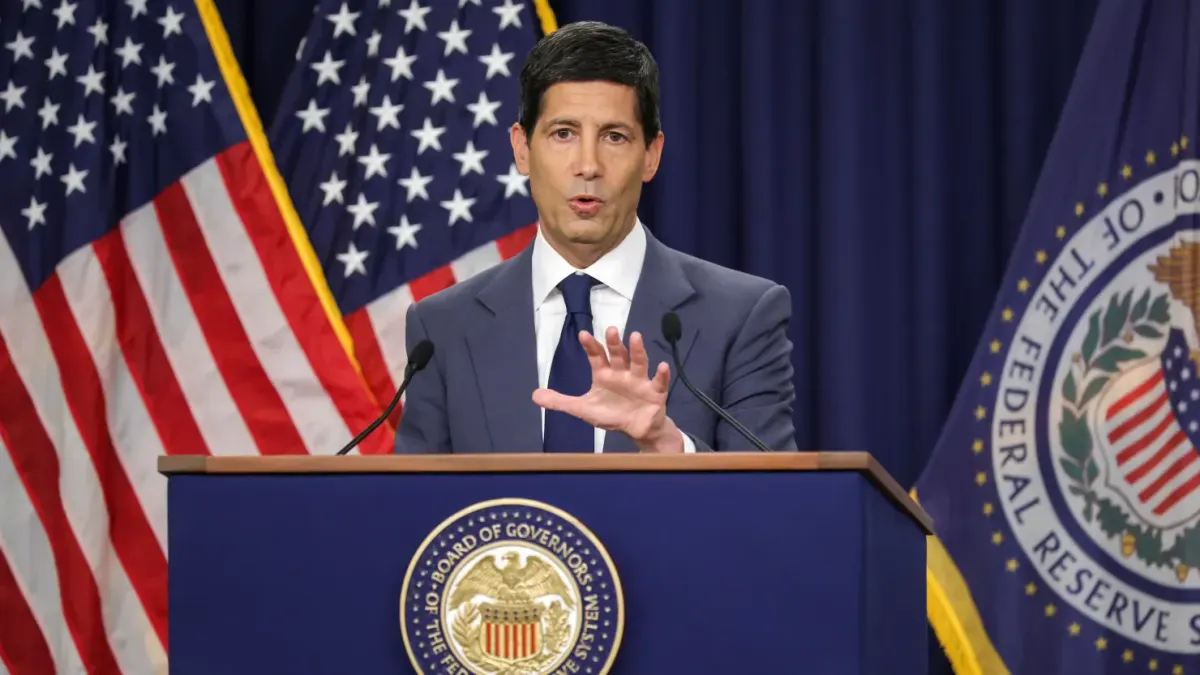
The pattern changed during Chair Kevin Warsh’s press conference.
Between immediately before the announcement and the end of the press conference at 3:04 p.m. ET, the two-year yield fell approximately 5.2 basis points, while the ten-year rose 2.7 basis points and the thirty-year climbed 5.3 basis points.
That’s a twist steepener: short-term yields declined while longer-term yields increased.
The official U.S. Treasury daily data tell a similar story over the full trading day:
| Treasury maturity | October 27 | October 28 | Change |
|---|---|---|---|
| 2-year | 4.70% | 4.67% | −3 bp |
| 10-year | 4.99% | 5.05% | +6 bp |
| 30-year | 5.30% | 5.37% | +7 bp |
The spread between ten-year and two-year yields widened from 29 to 38 basis points—a nine-basis-point steepening.
A note on the numbers: the intraday figures are live market quotes on the most recently issued notes, while the table uses Treasury’s official end-of-day constant-maturity curve. The two measure slightly different things, so their levels can differ by a few basis points. Both show the same pattern. [1]
What does that tell us?
Short-term Treasury yields are especially sensitive to expectations about the Fed’s policy path. The two-year yield reversed course during the press conference, suggesting investors modestly reassessed the extent or timing of future tightening.
But at 4.67%, the two-year yield remained roughly 80 basis points above the current federal funds rate midpoint. That is consistent with expectations of additional rate hikes. Fed funds futures also continued to price further tightening, including a roughly 78% probability of another hike in December.
Even after accounting for the term premium, the San Francisco Fed’s model estimated that investors expected overnight rates to average approximately 4.46% over the following two years as of October 27—roughly 60 basis points above today’s midpoint. This is a model-based estimate from the day before the meeting, not a direct measure of the October 28 reaction.
Long-term yields also reflect expected future interest rates, inflation, and compensation for uncertainty.
The increase in those yields could reflect the Fed’s assessment of strong economic activity, persistent inflation concerns, or greater compensation for holding long-term bonds.
Importantly, the full-day changes cannot be attributed entirely to the Fed. Oil prices were also rising amid renewed geopolitical tensions. To isolate the Fed’s effects, we need intraday comparisons around the announcement and press conference. [2]
3. What’s driving those higher long-term yields?
We can separate a nominal Treasury yield into two components:
Nominal yield = Real yield + Inflation breakeven
A nominal Treasury yield is the interest rate investors demand on ordinary government debt.
A real yield is the inflation-adjusted return implied by Treasury Inflation-Protected Securities (TIPS), whose principal adjusts with inflation.
The difference is called the inflation breakeven. It measures inflation compensation embedded in Treasury prices.
The underlying nominal and real yields come from the U.S. Treasury’s daily par yield curves, estimated from market quotations. We calculate breakevens by subtracting real yields from nominal yields at matching maturities.
Here’s the math.
Ten-year Treasury
- October 27: 4.99% nominal − 2.64% real = 2.35% breakeven
- October 28: 5.05% nominal − 2.67% real = 2.38% breakeven
The nominal yield increased six basis points. Three basis points came from higher real yields and three from higher inflation compensation.
Thirty-year Treasury
- October 27: 5.30% nominal − 3.05% real = 2.25% breakeven
- October 28: 5.37% nominal − 3.10% real = 2.27% breakeven
The nominal yield increased seven basis points. Five came from higher real yields and two from higher inflation compensation.
In other words, rising real yields accounted for half the increase in ten-year yields and approximately 71% of the thirty-year increase. Because each yield is rounded to one basis point, these shares are approximate.
These calculations explain the composition of the day’s changes. They don’t establish what caused them.
4. What does this tell us about inflation expectations?
The distinction between inflation compensation and expected inflation matters.
Breakevens capture investors’ inflation expectations, the additional compensation they demand for inflation risk, and differences in Treasury and TIPS market liquidity. [3]
So a three-basis-point rise in the ten-year breakeven doesn’t necessarily mean investors raised their inflation forecasts by three basis points.
We can learn more by examining the five-year, five-year forward inflation compensation rate, commonly called the 5y5y.
This measures inflation compensation implied for years six through ten, rather than the first five years.
The intuition is straightforward: the ten-year breakeven reflects compensation over ten years. Remove the contribution of the first five years, and what’s left is the implied compensation for the following five.
An approximate calculation is:
5y5y = (2 × 10-year breakeven) − 5-year breakeven
The five-year breakeven rose from 2.45% on October 27 to 2.49% on October 28.
Using October 28 observations:
(2 × 2.38%) − 2.49% = 2.27%
The same calculation gives approximately 2.25% on October 27. The exact compounded formula used for the Fed’s published 5y5y series on FRED gives the same results, 2.25% and 2.27%.
Thus, five-year inflation compensation increased four basis points, while the implied 5y5y rose roughly two basis points.
The implication: Inflation compensation increased more over the nearer five-year horizon than over years six through ten.
That’s consistent with concern about inflation remaining elevated over the medium term, without an equally large deterioration in the longer-run outlook.
But there’s another plausible explanation: oil prices.
Energy prices directly affect near-term inflation, so oil shocks can push shorter-horizon inflation compensation higher without producing an equally large increase in longer-run inflation expectations.
With oil prices rising Wednesday amid continuing Middle East tensions, the breakeven movements cannot be attributed solely to the Fed.
5. What explains higher real yields?
The increase in real yields raises another question: Are investors expecting stronger growth and more restrictive monetary policy, or demanding greater compensation for risk?
Real yields can be broken into three broad components:
TIPS real yield ≈ Expected future real short-term rates + Real term premium + TIPS-specific adjustments
Expected future real rates reflect the anticipated path of inflation-adjusted interest rates. Stronger growth or more restrictive expected monetary policy can push them higher.
The real term premium compensates investors for uncertainty about future real interest rates. TIPS-specific adjustments include liquidity and other security-related effects. [3]
These distinctions matter because higher real yields can reflect economic resilience, increased uncertainty, or both. [4]
Economists use term-structure models to investigate. Models such as Adrian–Crump–Moench, Kim–Wright, and Christensen–Rudebusch decompose nominal Treasury yields into:
Nominal yield ≈ Expected future nominal short-term rates + Nominal term premium
This differs from our earlier decomposition. Instead of separating nominal yields into real yields and inflation compensation, it separates them into expected interest rates and compensation for holding long-term bonds.
The San Francisco Fed’s Christensen–Rudebusch model estimated a ten-year nominal term premium of approximately 1.25 percentage points on October 27. [5]
That estimate uses zero-coupon Treasury yields rather than the par yields in our earlier calculations. It also has model uncertainty, making small daily changes difficult to interpret.
The October 28 model decomposition, not yet published as of this writing, is needed to establish whether the increase in nominal yields reflected higher expected short rates, a higher term premium, or both.
Models that jointly analyze nominal Treasuries and TIPS can go further by estimating expected real interest rates and real risk premiums. But those are model-based estimates, not directly observed market prices.
What we know is that long-term financing conditions tightened over the day. Whether stronger growth expectations or higher risk premiums dominated the increase in real yields remains unresolved.
6. Why it matters: The Fed is betting inflation will cool
As I explained in my recent newsletter, plugging August’s 3.4% PCE inflation into a standard Taylor rule produces a policy rate near 5.3%, roughly 1.5 percentage points above today’s midpoint. [6]
The latest data point the same way. PCE inflation rose to 3.6% in September, up from 3.4% in August, according to data released today. Core PCE inflation was roughly unchanged at 3.1%.
Applying the same Taylor-rule specification to September’s 3.6% headline PCE inflation raises the prescribed policy rate to approximately 5.6%, holding the other assumptions constant. The Fed’s 2% inflation target is defined using headline PCE inflation.
The Fed’s projected path makes more sense if inflation slows substantially.
But the Cleveland Fed’s estimate of expected CPI inflation over the next year rose from 2.40% in August to 2.98% in October. And the continuing energy shock threatens to keep inflation elevated.
What happens if the Fed’s bet doesn’t pay off?
If inflation remains elevated and expectations continue rising, the Fed may need to raise rates further than currently projected.
Under the Taylor rule used in my newsletter, every 0.1-percentage-point increase in expected inflation raises the prescribed policy rate by approximately 15 basis points, holding other assumptions constant.
After adjusting expected CPI inflation to an approximate PCE basis, as in my newsletter, the rule calls for a rate above the 4.00%–4.25% range that one additional hike would deliver if expected CPI inflation climbs above roughly 3.1% (about 2.7% on a PCE basis).
The danger is that persistent inflation changes behavior. Businesses become more willing to pass higher costs to customers, while workers demand larger raises to protect their purchasing power.
That could turn an energy shock into more persistent inflation, forcing the Fed to tighten more aggressively later.
And financial markets may not wait for the Fed to act.
If investors anticipate higher inflation, a more restrictive policy path, or greater long-term risks, borrowing costs could rise further before the next policy decision.
Higher interest rates cannot restore disrupted oil supplies. They can restrain demand and limit inflation spillovers, but at the cost of weaker spending, investment, and employment.
The bottom line: The Fed is betting inflation will cool enough to avoid substantially more tightening. But investors are still anticipating additional hikes. Higher real yields and inflation compensation are putting pressure on long-term borrowing costs.
The risk is that waiting too long forces the Fed to do more later, after financial markets have already tightened conditions for households and businesses.
The Fed can pause. The bond market doesn’t have to.
Notes
[1] Intraday figures are market quotes from investingLive, measured from just before the 2:00 p.m. ET statement to the end of the press conference at 3:04 p.m. ET. Over that window, the 2-year fell from 4.770% to 4.718%, the 10-year rose from 5.020% to 5.047%, and the 30-year rose from 5.318% to 5.371%. Daily figures are from the U.S. Treasury’s par yield curve.
[2] On identifying monetary policy effects with narrow windows around announcements, see Gürkaynak, Sack and Swanson (2005), “Do Actions Speak Louder Than Words? The Response of Asset Prices to Monetary Policy Actions and Statements,” International Journal of Central Banking; Nakamura and Steinsson (2018), “High-Frequency Identification of Monetary Non-Neutrality: The Information Effect,” Quarterly Journal of Economics; and Bauer and Swanson (2023), “A Reassessment of Monetary Policy Surprises and High-Frequency Identification,” NBER Macroeconomics Annual.
[3] On the components of breakevens and the TIPS liquidity premium, see Gürkaynak, Sack and Wright (2010), “The TIPS Yield Curve and Inflation Compensation,” American Economic Journal: Macroeconomics; and D’Amico, Kim and Wei (2018), “Tips from TIPS: The Informational Content of Treasury Inflation-Protected Security Prices,” Journal of Financial and Quantitative Analysis.
[4] Hanson and Stein (2015), “Monetary Policy and Long-Term Real Rates,” Journal of Financial Economics, find that monetary policy news moves long-term real yields largely through term premiums.
[5] The model is described in Christensen and Rudebusch (2012), Economic Journal, and estimated on zero-coupon yields from Gürkaynak, Sack and Wright (2007), Journal of Monetary Economics. Its October 27 estimate: 10-year yield 4.97%, average expected short rate 3.72%, term premium 1.25%. The model’s residual is included in the term premium. Other daily estimates include Adrian, Crump and Moench (2013), Journal of Financial Economics, and Kim and Wright (2005), Federal Reserve FEDS working paper.
[6] Taylor (1993), “Discretion versus Policy Rules in Practice,” Carnegie-Rochester Conference Series on Public Policy. My calculation uses a 1.2% neutral real rate (the Fed’s 3.2% longer-run funds rate minus 2%) and unemployment at the Fed’s 4.2% longer-run estimate. With an inflation coefficient of 1.5, each 0.1-point rise in inflation adds 15 basis points. Cleveland Fed expectations are adjusted from CPI to an approximate PCE basis. Full details are in the newsletter.
[7] Divounguy (2026), “How And Why Economic Data Moves Mortgage Rates.” The estimates use daily Optimal Blue 30-year conforming lock rates and Treasury yields from January 2017 through September 2026; the mortgage-spread model uses weekly data from 1990.