Homebuilding Is Cooling — the Pullback Is Mostly Single-Family, with Multifamily Still ~26% Below Its Pre-Pandemic Trend
Homebuilders continue to pullback

Key Takeaways
- Single-family is where the slowdown lives. Single-family permits fell 4.6% year-over-year through June, starts 5.3%, and completions 9.3% — while multifamily permits rose 5.3%.
- Below the old trajectory after the boom. After surging during the pandemic, single-family permits have fallen back below their 2016–2019 trend — now about 23% under it, with multifamily about 26% under. Both overshot, then dropped below the path they were on.
- The pullback is broad but not universal. Single-family permits are down in roughly two-thirds of the 50 largest metros — led by Sun Belt boomtowns like Las Vegas, Charlotte, and Orlando — yet Boston, San Francisco, and Miami are still adding homes.
- Builders are sitting on more approved projects than a year ago. The backlog of authorized-but-unstarted single-family homes rose to 147,000 in June from 142,000 a year earlier — about 1.78 months of permits, up from 1.69. More approved homes are waiting rather than breaking ground.
- Cooling now — with the leading indicators pointing to more softness ahead. Single-family starts are still about 6% above their 2018–19 average, but permits lead starts, and permits are already falling. The front of the pipeline is weaker than the back.
The housing market has spent much of the past four years adjusting to a world of higher interest rates. Now that adjustment is showing up more clearly in construction.
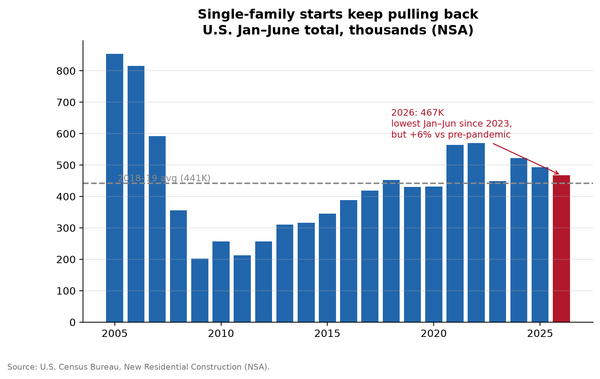
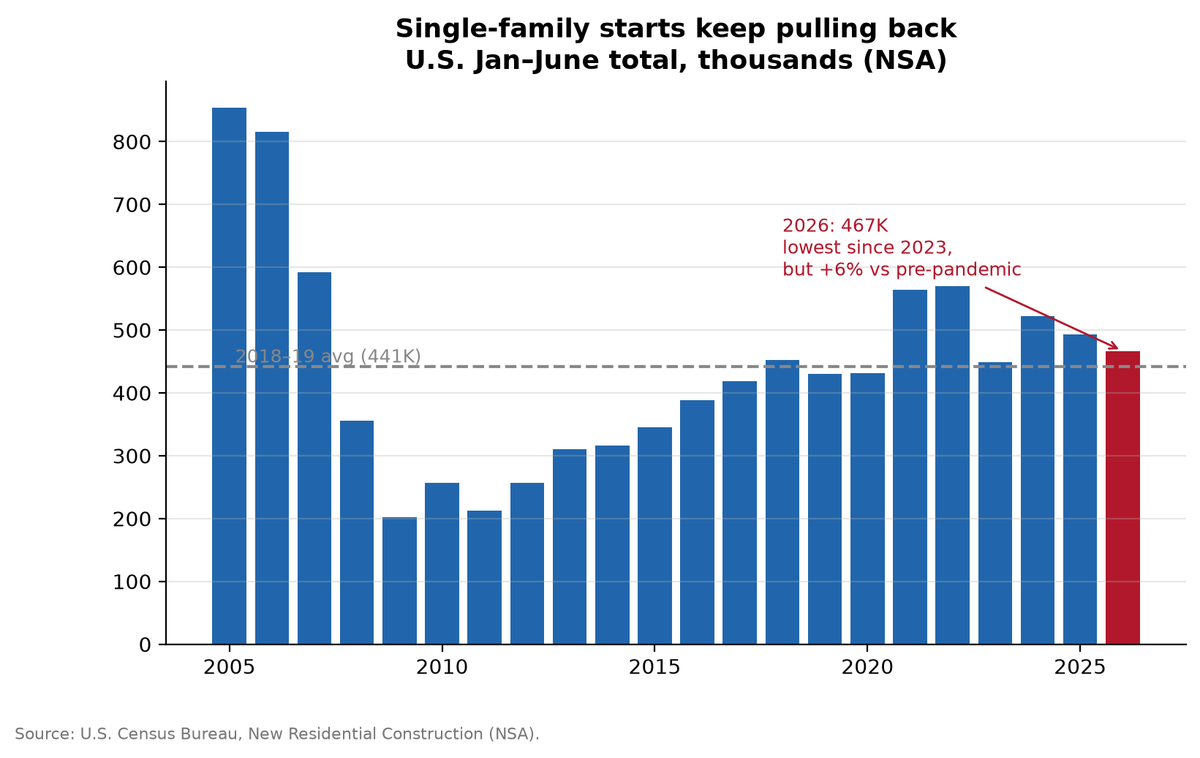
Through June, builders started about 467,000 single-family homes, the weakest January-to-June pace since 2023. Single-family permits and completions are falling as well. And while construction is nowhere near collapse, the direction is clear: builders are pulling back from the pace of the past several years.
Demand helps explain why.
New-home sales ran at a 628,000 seasonally adjusted annual rate in June, up 1.6% from May but 5.6% below a year earlier. There were 9.3 months of new homes available for sale at the current sales pace. Builders can still move homes, but doing so increasingly requires incentives, including mortgage-rate buydowns.
The market is simply not giving builders much reason to keep building.
1. The pullback is concentrated in single-family construction
The clearest divide in the data is between single-family and multifamily construction.
Through June, compared with the same six months last year:
- Single-family permits fell 4.6%; multifamily permits rose 5.3%.
- Single-family starts fell 5.3%; multifamily starts rose 17.0%.
So this isn’t a uniform construction downturn.
The segment most directly exposed to mortgage rates and individual homebuyers is weakening, while multifamily permits have held up better.
But the year-over-year comparison tells only part of the story. Relative to the growth path established between 2016 and 2019, both sectors remain subdued. Single-family permits are roughly 23% below their late-2010s trajectory, while multifamily permits are about 26% below theirs.
The cleaner interpretation is that after the pandemic building boom pushed construction well above its pre-2020 trend, both sectors have since fallen back below it — single-family is dropping year-over-year, and multifamily, though up from last year, sits even further below its old trajectory. Neither is on the path it was traveling before the pandemic.

2. Most large metros are building fewer single-family homes
The slowdown is geographically broad.
Single-family permits are down in roughly two-thirds of the 50 largest metro areas through the first half of the year.
Among these large metros, the biggest declines include:
| Metro | 2026 YTD | 2025 YTD | YoY |
|---|---|---|---|
| Las Vegas | 3,899 | 5,393 | −28% |
| Charlotte | 6,827 | 9,073 | −25% |
| Orlando | 6,534 | 8,599 | −24% |
| Hartford | 254 | 312 | −19% |
| Fresno | 1,170 | 1,428 | −18% |
| Pittsburgh | 1,648 | 1,967 | −16% |
| New York | 5,163 | 6,081 | −15% |
| Portland | 2,841 | 3,316 | −14% |
| Phoenix | 11,966 | 13,834 | −14% |
| Philadelphia | 3,667 | 4,159 | −12% |
Phoenix stands out because of its scale. Even after a 14% decline, builders there permitted nearly 12,000 single-family homes through June — meaning a relatively modest percentage pullback translates into a large reduction in the number of homes entering the pipeline.
But the weakness isn’t universal. There are still large markets where builders are adding more single-family homes than they did last year:
| Metro | 2026 YTD | 2025 YTD | YoY |
|---|---|---|---|
| Boston | 2,000 | 1,606 | +25% |
| San Francisco | 1,453 | 1,263 | +15% |
| Virginia Beach | 1,846 | 1,606 | +15% |
| Miami | 3,112 | 2,732 | +14% |
| Memphis | 1,779 | 1,567 | +14% |
| Kansas City | 2,813 | 2,501 | +12% |
| Los Angeles | 6,619 | 6,140 | +8% |
| Cincinnati | 2,410 | 2,249 | +7% |
| Seattle | 3,323 | 3,179 | +5% |
| Oklahoma City | 3,442 | 3,310 | +4% |
That’s the important geographic story: homebuilding is slowing across much of the country, but this is not a synchronized national retreat.

3. Builders also have more approved homes waiting to start
Permits tell us how many homes builders receive authorization to construct. They don’t tell us how quickly those projects actually break ground.
That distinction matters right now.
The number of single-family homes authorized but not yet started has risen over the past year — to about 147,000 in June from 142,000 a year earlier. Relative to the recent pace of new permits, that’s roughly 1.78 months of permits sitting in the backlog, up from 1.69 a year ago.
The queue is growing even as permit issuance slows.
It should not be read as a literal measure of how long the average permit waits before construction begins. But it does tell us something important: the stock of approved-but-unstarted homes has grown relative to the flow of new permits.
In other words, slowing permit issuance may actually understate the degree of caution in the market. Builders already have a substantial number of projects approved, yet many remain in the queue rather than moving immediately into construction.
The same phenomenon exists in multifamily, where projects naturally take longer to move from authorization to groundbreaking.

4. Today looks like cooling — but the leading indicators point lower
It is easy to look at falling permits and conclude that homebuilding is falling off a cliff. Today’s levels say otherwise.
Single-family starts are still running about 6% above their 2018–19 average. The housing market went through an extraordinary pandemic-era construction cycle, and what we’re seeing now looks less like the disappearance of homebuilding than a normalization from unusually strong levels.
But that’s a snapshot of the back of the pipeline, and the front is weaker.
Permits lead starts, and permits are already falling — down 4.6% year-over-year and about 23% below their pre-pandemic trend. Starts and completions follow permits with a lag, so the softness in permits today is a signal that starts and completions have further to fall. Builders are also sitting on a growing backlog of approved-but-unstarted homes, so even the permits already issued aren’t translating quickly into construction.
Higher mortgage rates continue to constrain affordability, and new-home demand remains soft. Builders have little reason to expand production while they work through existing inventory and approved projects.
Put together, the picture isn’t a crash in today’s numbers — it’s a still-elevated level of building with a pipeline pointing steadily downward. The honest read is stability now, giving way to a lower level ahead — not a rebound.

The bottom line
The housing market still needs more homes over the long run. But right now, the level of building is holding up while the pipeline that feeds it is thinning — permits down, the backlog of unstarted homes growing, and demand soft. The signal from builders is pretty clear:
They are willing to build. They just aren’t willing to build as much as they were — and the permits point to less ahead.
A note on method and sources
All construction figures are not seasonally adjusted (NSA), from the U.S. Census Bureau’s Building Permits Survey (metro/CBSA permit files) and New Residential Construction (starts, completions, and authorized-but-not-started), for reference month June 2026. Year-to-date comparisons cover January–June in both years, substantially limiting seasonal-composition effects.
Pre-pandemic trend: OLS on January 2016 through December 2019 of the log level on a linear time trend plus month-of-year dummies, extrapolated forward; the month dummies absorb NSA seasonality. Extrapolating the 2016–2019 trend forward is illustrative, not a forecast. Single-family permits sit ~23% below this trend while single-family starts run ~6% above their 2018–19 average — different series measured consistently; permits lead starts, so permits below trend while starts remain above is an early-slowdown signature.
Months of backlog = authorized-but-not-started ÷ trailing-three-month average permit pace. Metro tables cover the 50 largest metropolitan areas by 2024 population; “multifamily” is the sum of 2-unit, 3–4-unit, and 5+-unit structures; the U.S. total is Census’s own national figure, not a sum of metros.
Sources: U.S. Census Bureau — Building Permits Survey; U.S. Census Bureau — New Residential Construction; Zillow — New Home Sales, June 2026.